📤 Export survey results
Zest allows you to export your survey results to analyze or share them more easily. Several formats are available: Excel, PowerPoint, and sensitive comments.
📊 Excel
Zest is upgrading the Excel export format for your Survey results to give you faster, more reliable data analysis. This article explains what's changing, how the file is structured, and how to generate it.
🧱 A new format designed for analysis
The new structure is based on a simple principle: each row in the file corresponds to a unique combination of a question and an analysis context (global view, population filter, or comparison value).
In practice, this lets you:
- Easily compare your populations and analysis dimensions
- Read structured, consistent data, with no manipulation needed beforehand
- Work directly in Excel (sorting, filtering, pivot tables)
- Save time analyzing your results
🧐 How the file is structured
The Excel file now includes three tabs, each serving a different analysis need:
| Tab | Content | One row corresponds to... |
|---|---|---|
| Score and Participation | Aggregated view: participation rate, number of respondents, score, rating /10, % positive/neutral/negative responses | One question x one analysis context (global, population filter, comparison) |
| Scored Questions | Individual response detail for scale-based questions (types Weather, Mood, NPS, Stars, Slider) | One respondent's answer to one question, with any comment and its sensitivity |
| Non-Scored Questions | Individual response detail for open or choice-based questions (types Free text, Single choice, Matrix - Single choice) | One respondent's answer to one question, with the sensitivity of the associated comment |
In the Score and Participation tab, the row-by-row logic works as follows:
- Each row = one question + one analysis context (survey, session, population, filter)
- Columns are grouped into two families of information:
- context information: survey name, iteration dates, population segment, applied filters
- result indicators: participation rate, number of respondents, score, rating /10 or on the original scale, % of responses
💡 In practice, within this tab:
- In global view, you get a single row per question.
- As soon as you apply comparisons (populations, filters), you get multiple rows per question — one per compared context.
The Scored Questions and Non-Scored Questions tabs stay at the respondent level: they let you retrieve the detail of each individual response (useful in particular for verbatim analysis), in addition to the aggregated view in the first tab.
🚀 Exporting your Excel report
Step 1 – Go to Detailed Results
- Go to the Survey module.
- Click the Detailed Results tab.
- Adjust your Filters if needed (population, session, benchmark).
!Capture d'écran 2026-07-29 à 18.56.13.png
Step 2 – Start the export
- In the top right of the screen, click Export results.
- From the menu that appears, select Excel Report.
!Capture d'écran 2026-07-29 à 18.43.37.png
Step 3 – Choose the scope of your export
- An Export Excel Report for the Survey window opens.
- By default, the report data matches your filter selection exactly.
- Turn on Extend selection to all your custom segments if you want to widen the export to all your departments, locations, or teams, beyond your initial filter.
!Capture d'écran 2026-07-29 à 18.44.49.png
- Click Export.
!Capture d'écran 2026-07-29 à 18.57.48.png
!Capture d'écran 2026-07-29 à 18.57.56.png
ℹ️ Depending on the data volume, the file will be available immediately or sent to you by email.
⚠️ When the Excel export isn't available
⚠️ Note: the Excel export isn't possible in the following cases:
- Benchmark data is set in your filters;
- You're comparing multiple sessions against each other.
In these two cases, remove the benchmark or narrow your selection to a single session to generate your export.
🔐 About data confidentiality
To protect respondent anonymity, populations that haven't reached the anonymity threshold will not appear in the exported report.
📊 PowerPoint export
Zest lets you export your Survey and Engagement Meter results as a ready-to-use PowerPoint presentation. This article explains what this feature is for, how it's structured, and how to use it to present your results to your teams or leadership.
The PowerPoint export now gives you:
- ✅ a professional design, aligned with your brand identity,
- ✅ a presentation you can use right away, without systematic manual editing,
- ✅ educational content that puts your data in context rather than displaying raw numbers,
- ✅ an analysis faithful to what you see in the tool: trends, comparisons, benchmarks.
How is your PPT export structured?
The generated PowerPoint file always follows the same outline, designed to be readable by a non-expert audience (managers, HR, leadership):
| Section | Content |
|---|---|
| Cover page | Your company logo alongside the Zest logo |
| Section — Context | 1 context slide about the Survey or Engagement Meter, followed by a recap of the questions asked (one or more slides depending on the number of questions) |
| Section — Detailed Results | Your overall score (summary slide + comparison slide if applicable), then the breakdown by theme |
| By theme | For each question within the theme, in the order it appears in the outline: a summary slide (always included), a comparison / trend / benchmark slide (if the corresponding filters are active), and a comment analysis slide (if the option is enabled and comments exist) |
| "Other" theme | Groups, at the end of the presentation, the questions that aren't attached to any theme |
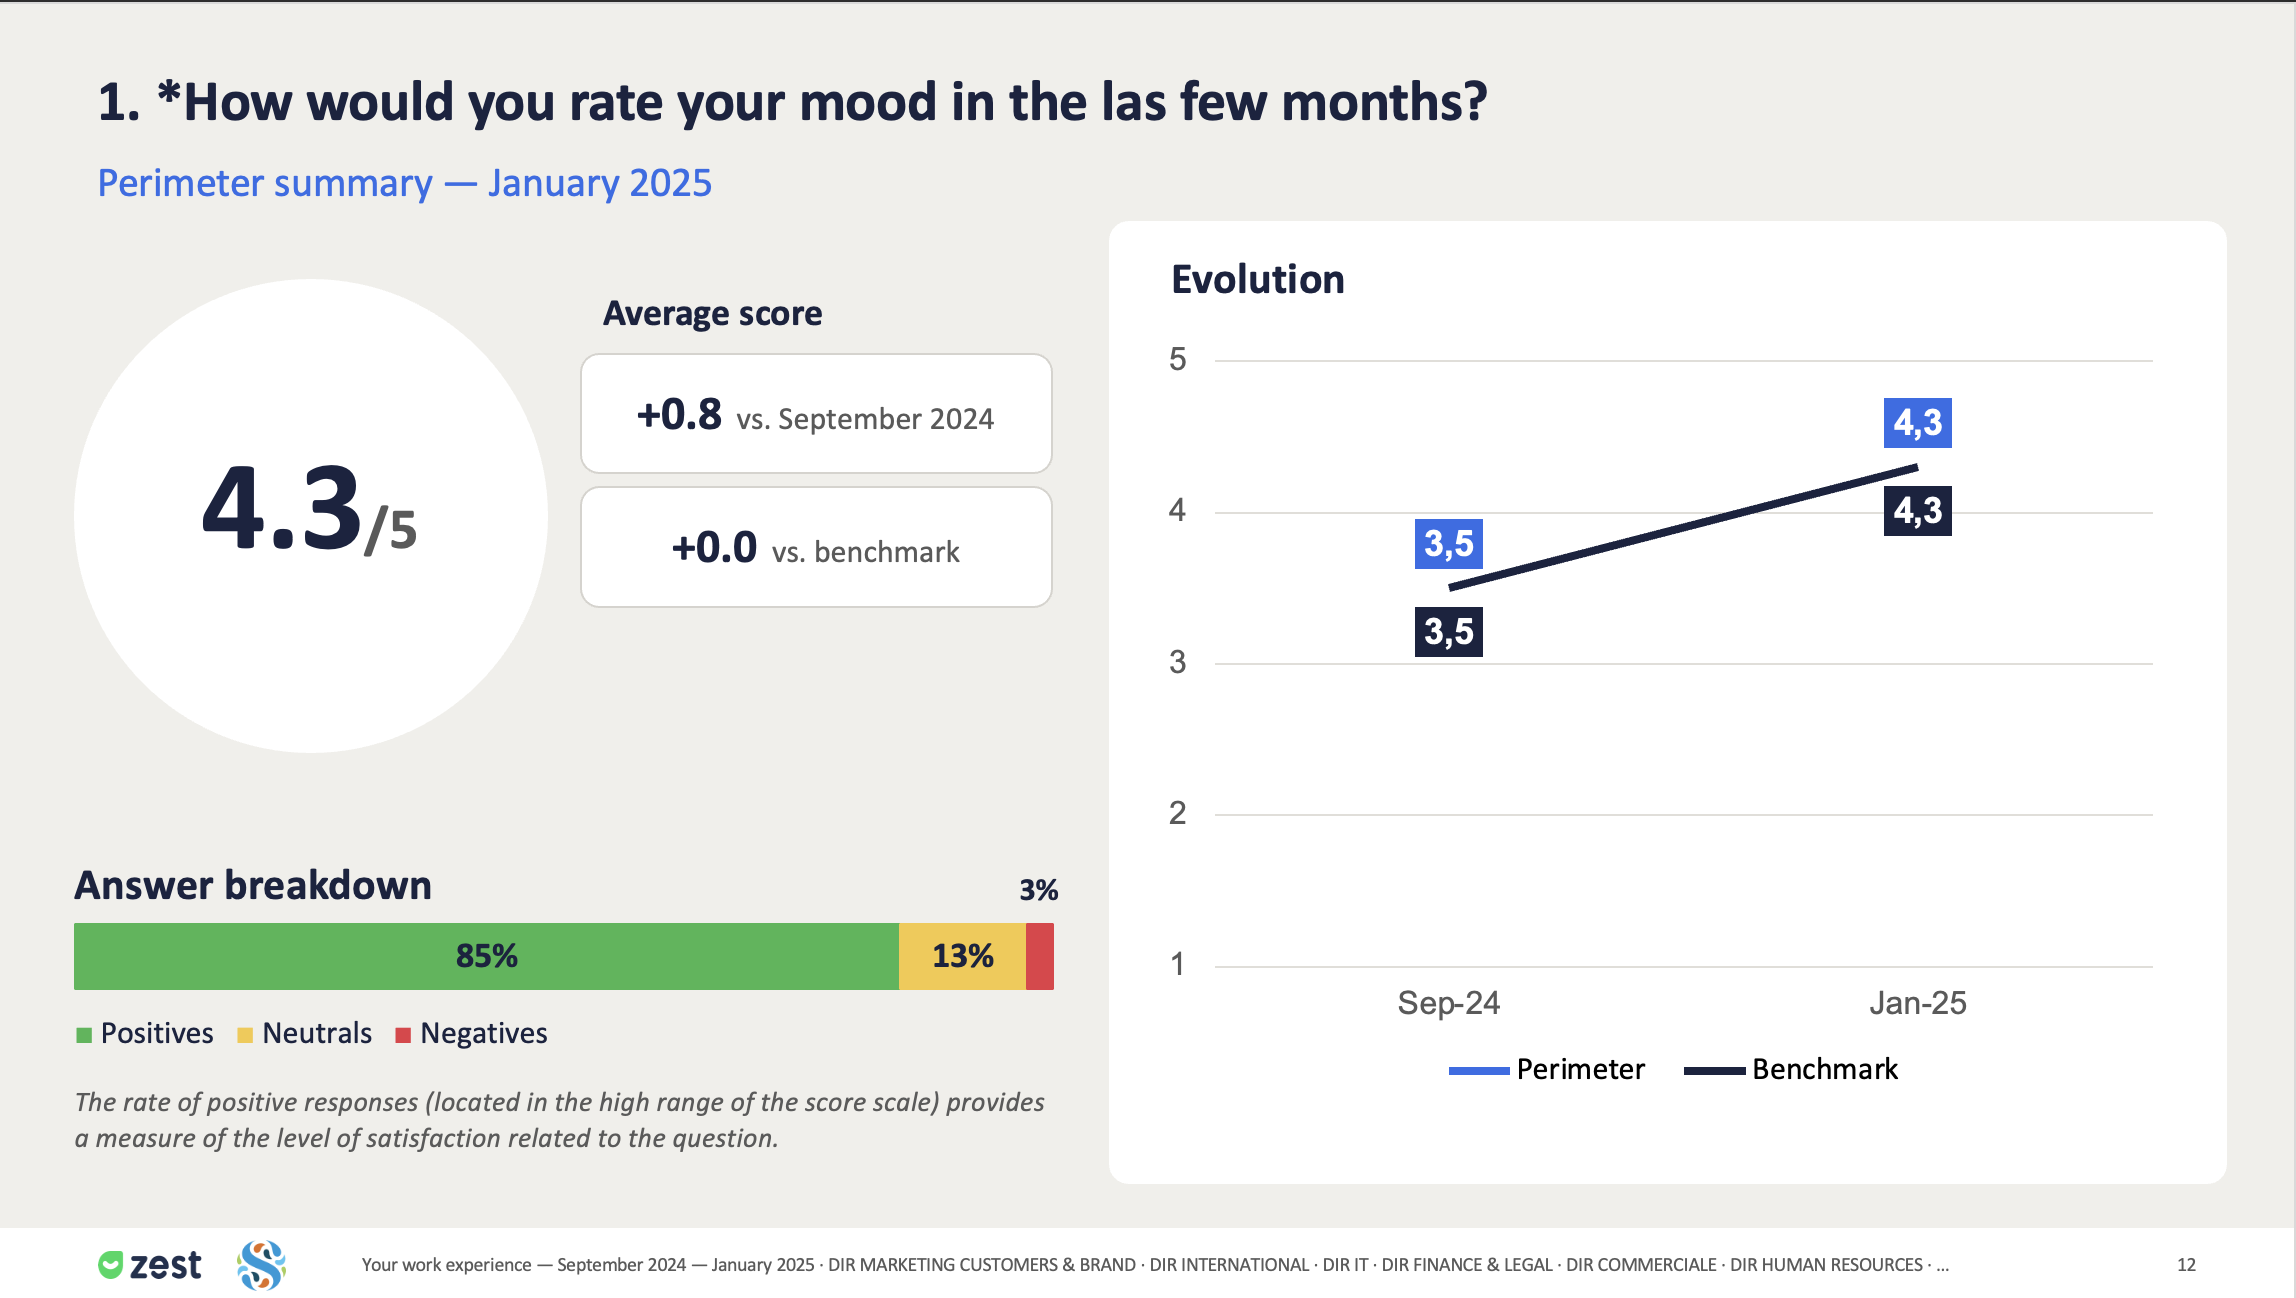
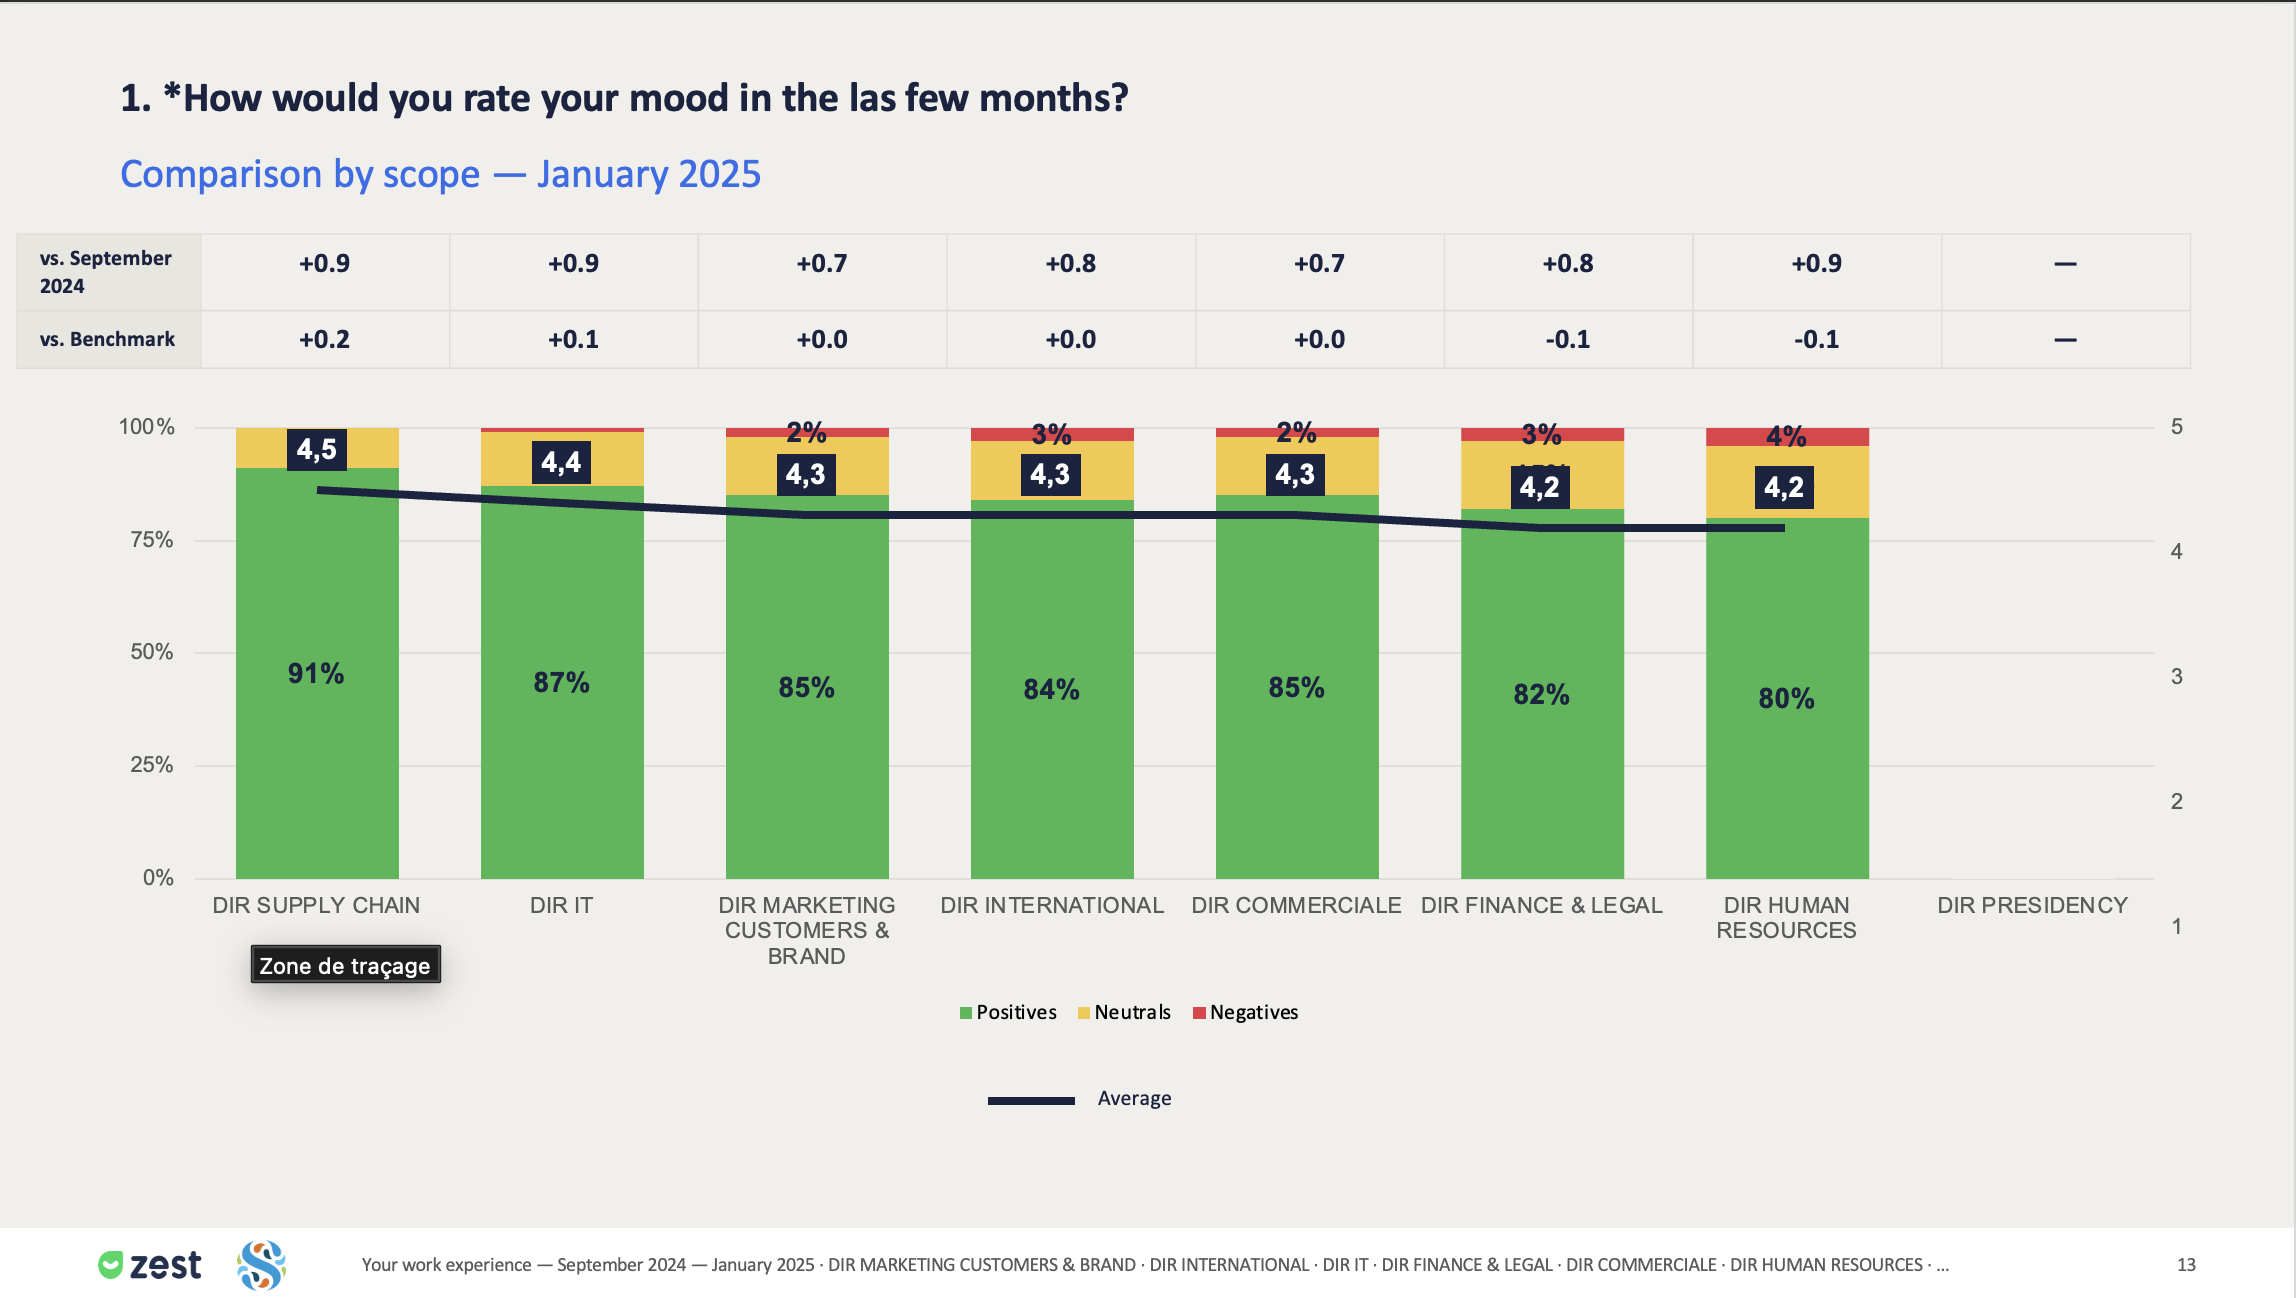
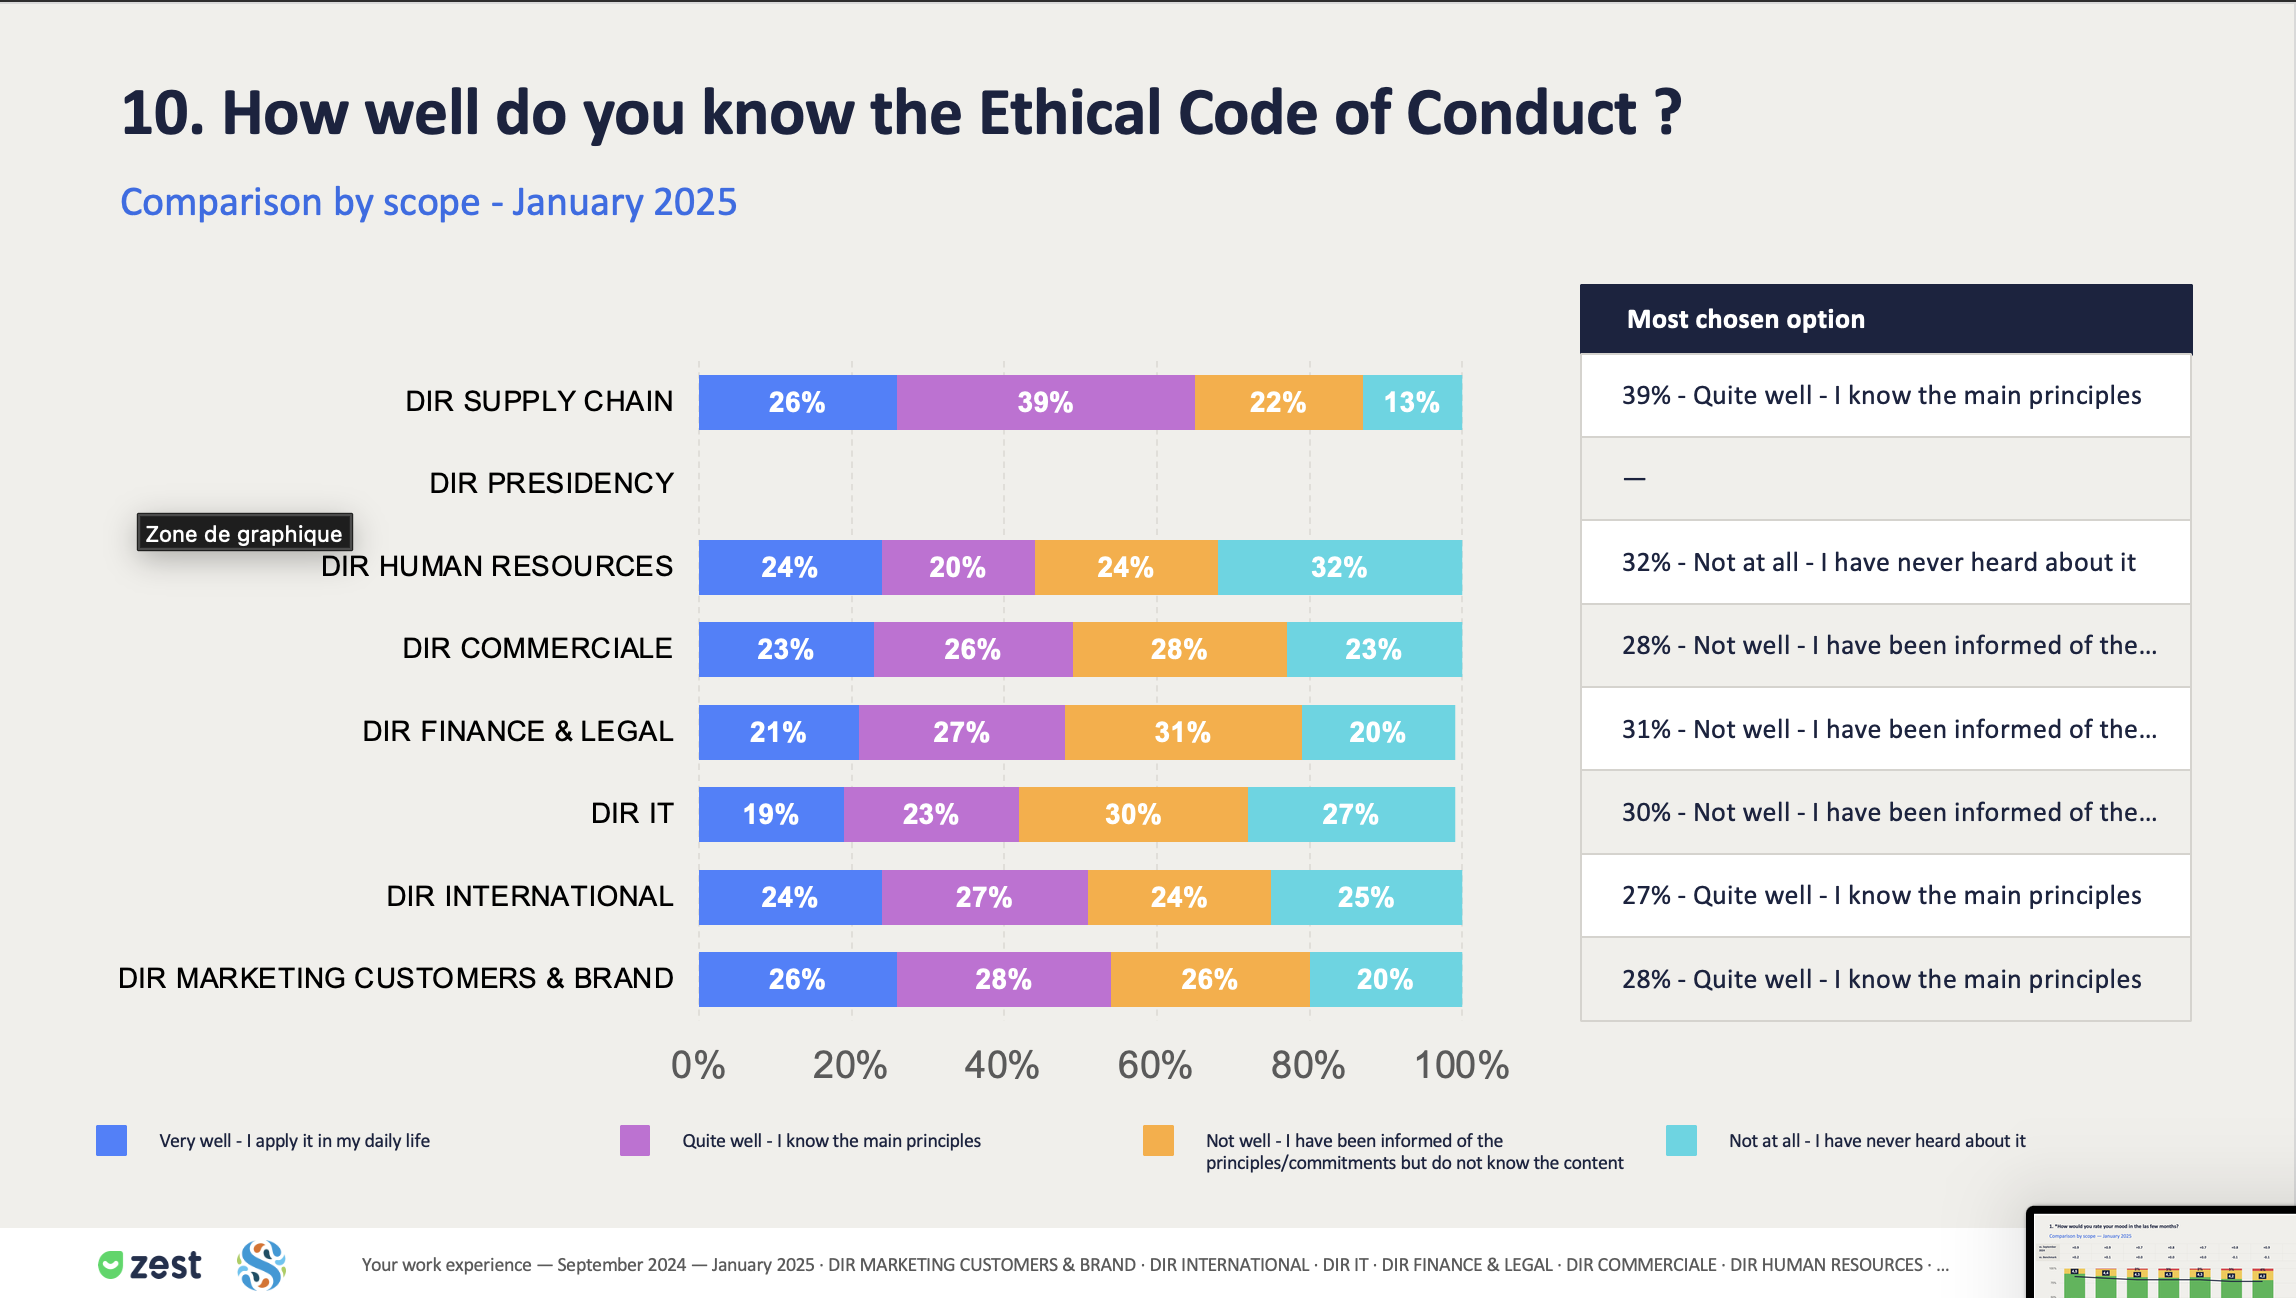
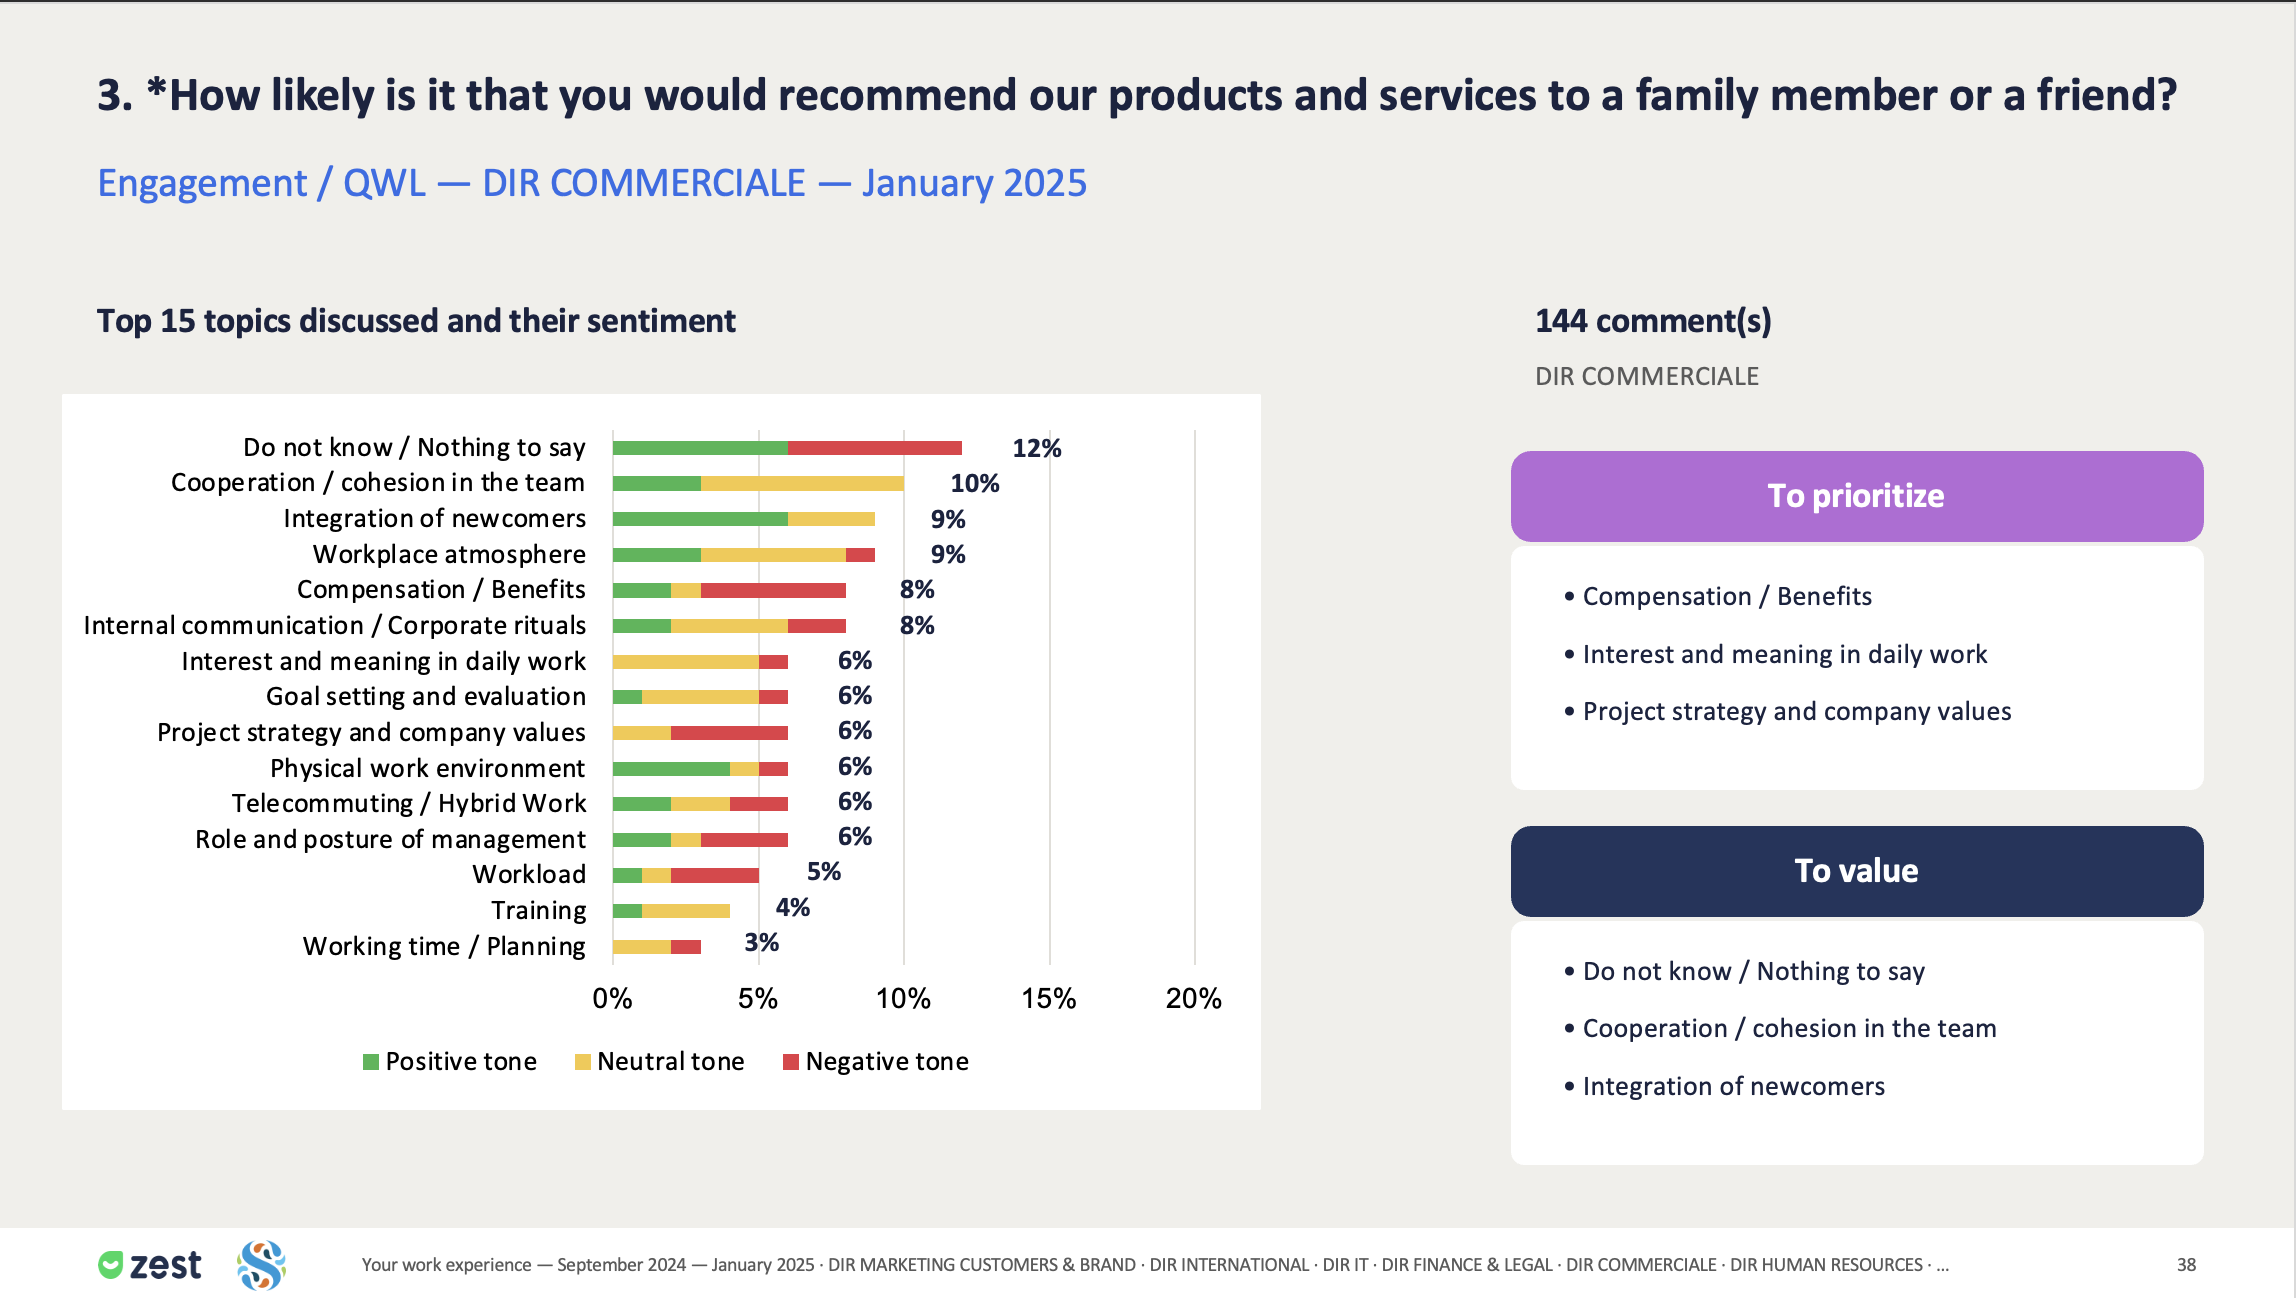
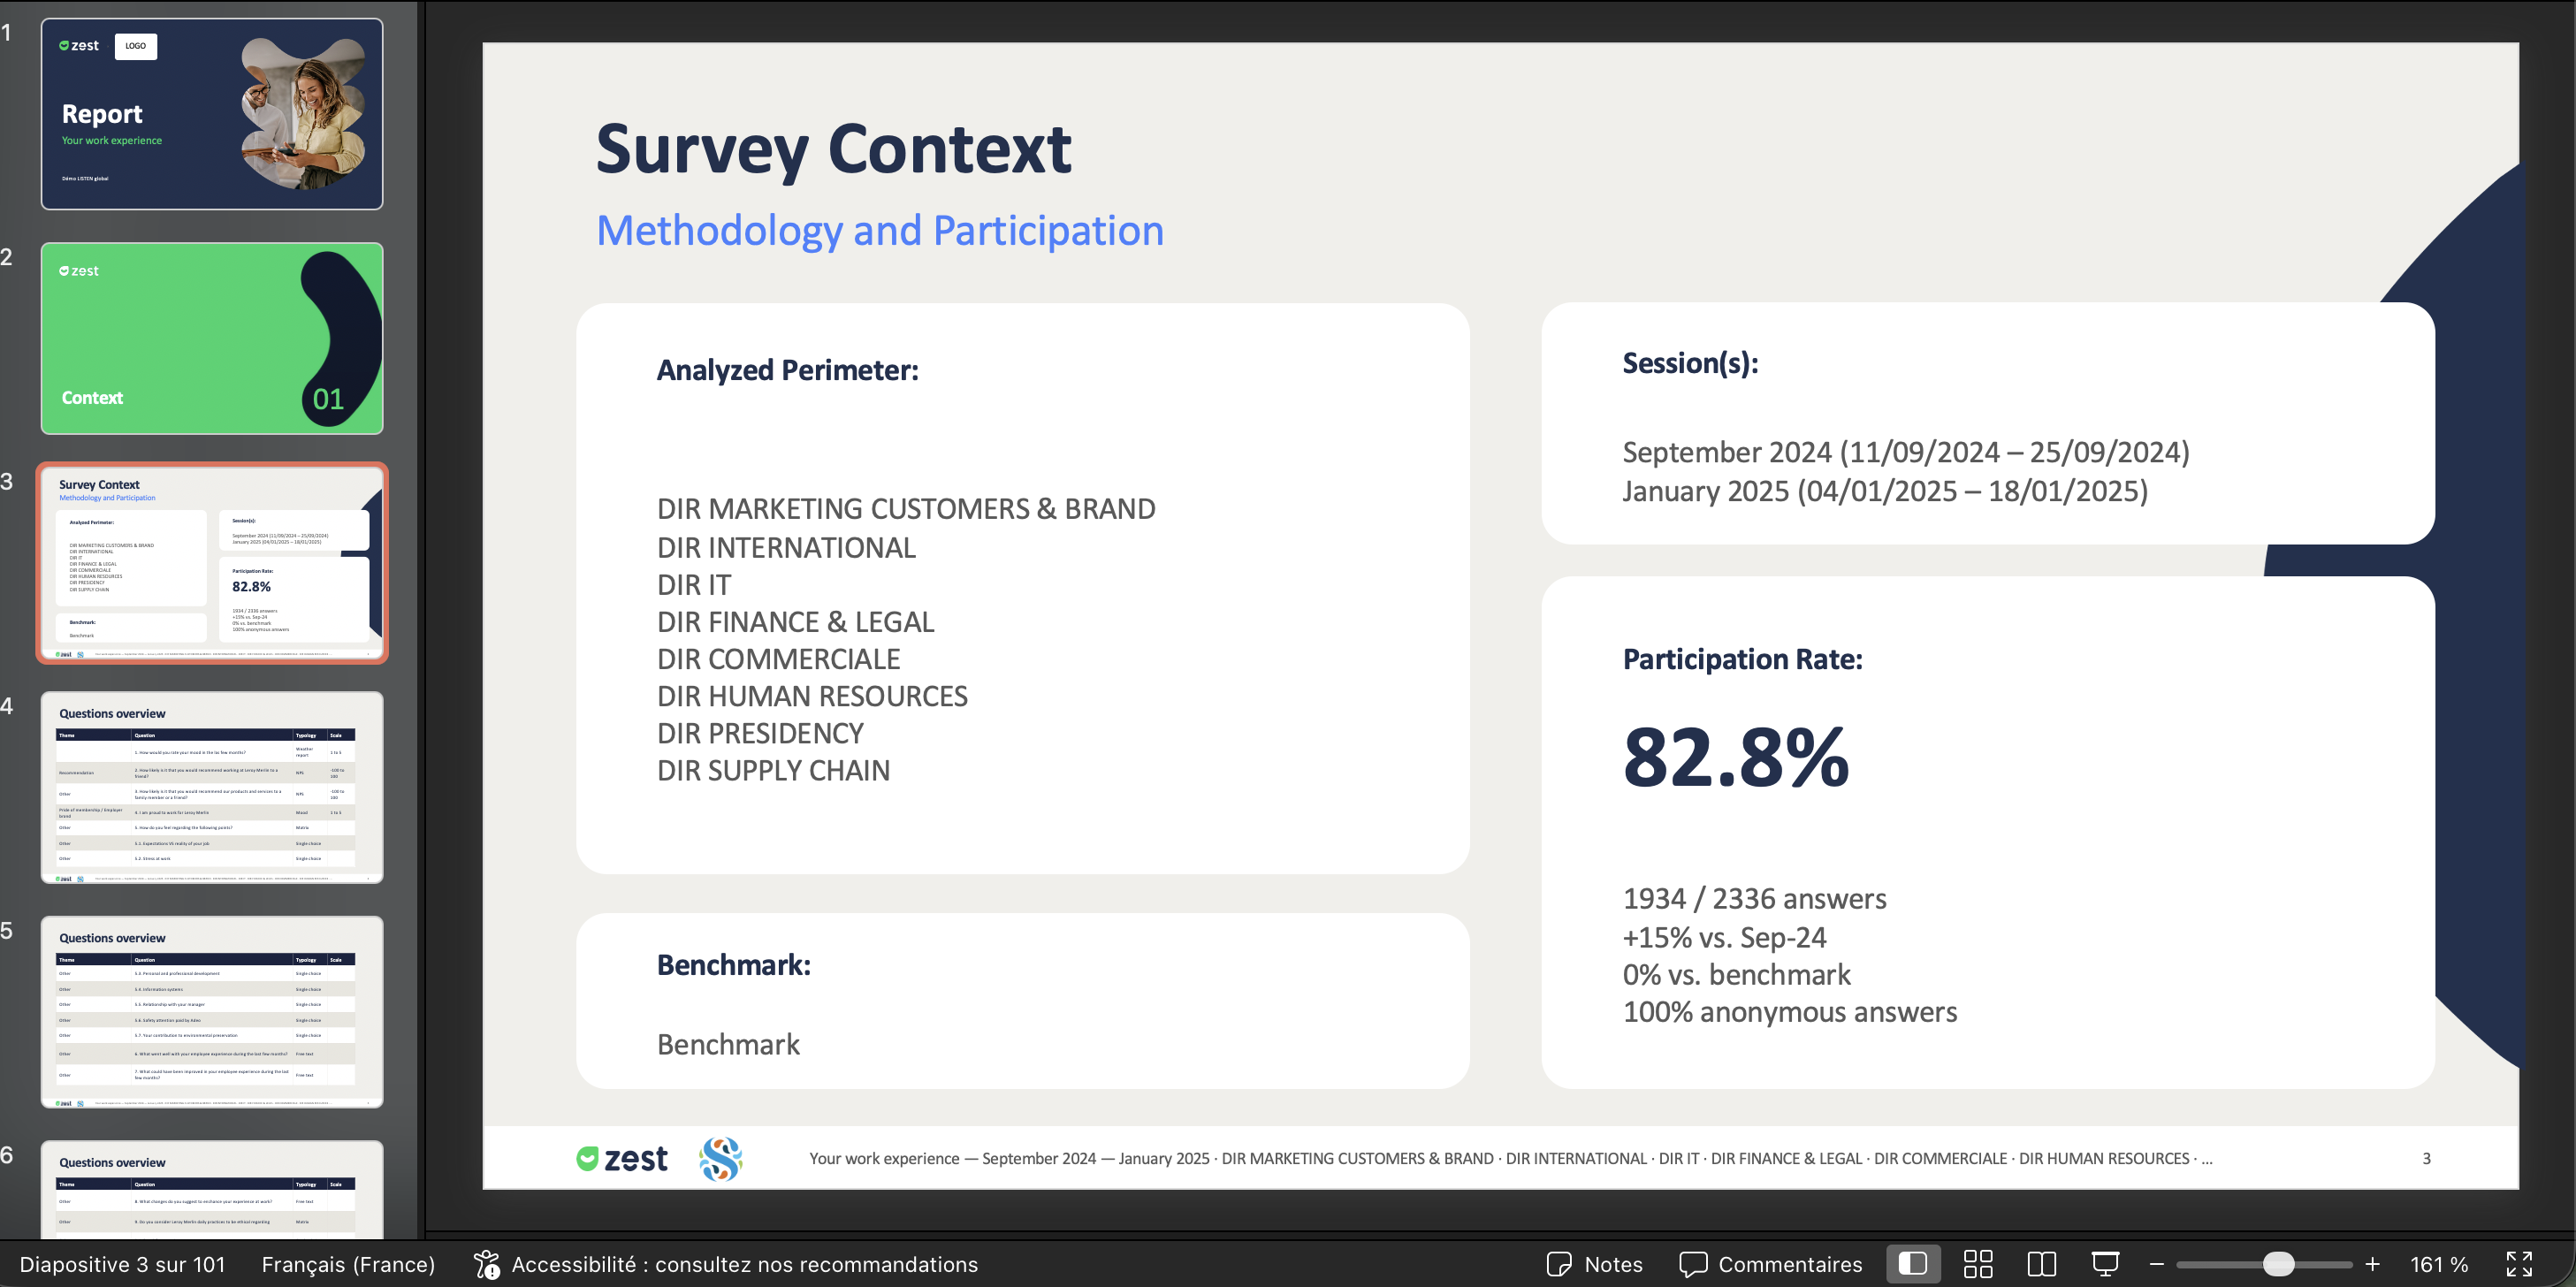
👉 Good to know: the slide order exactly follows the order of themes and questions in your survey outline.
If you want to change this order in the PPT, you first need to reorganize your survey outline.
The export automatically picks up the active filters on the Detailed Results page at the moment you launch the export. So it's the configuration of this page (department comparison, trend between two sessions, benchmark on your scope, etc.) that determines whether comparison, trend, or benchmark slides appear in your presentation.
To generate this export, you need the Manager, HR, or SuperAdmin role, along with read access to this survey's results.
👉 Each of these roles can only export results within their own scope (for example: a Manager exports their team's results, an HR user exports results within their HR scope).
If you don't see this option, or if the scope shown doesn't match what you expect, reach out to your HR team or a Zest SuperAdmin.
🚀 Launching the PowerPoint export of your results
The export is available from the Analyze tab, in the top right of the interface:
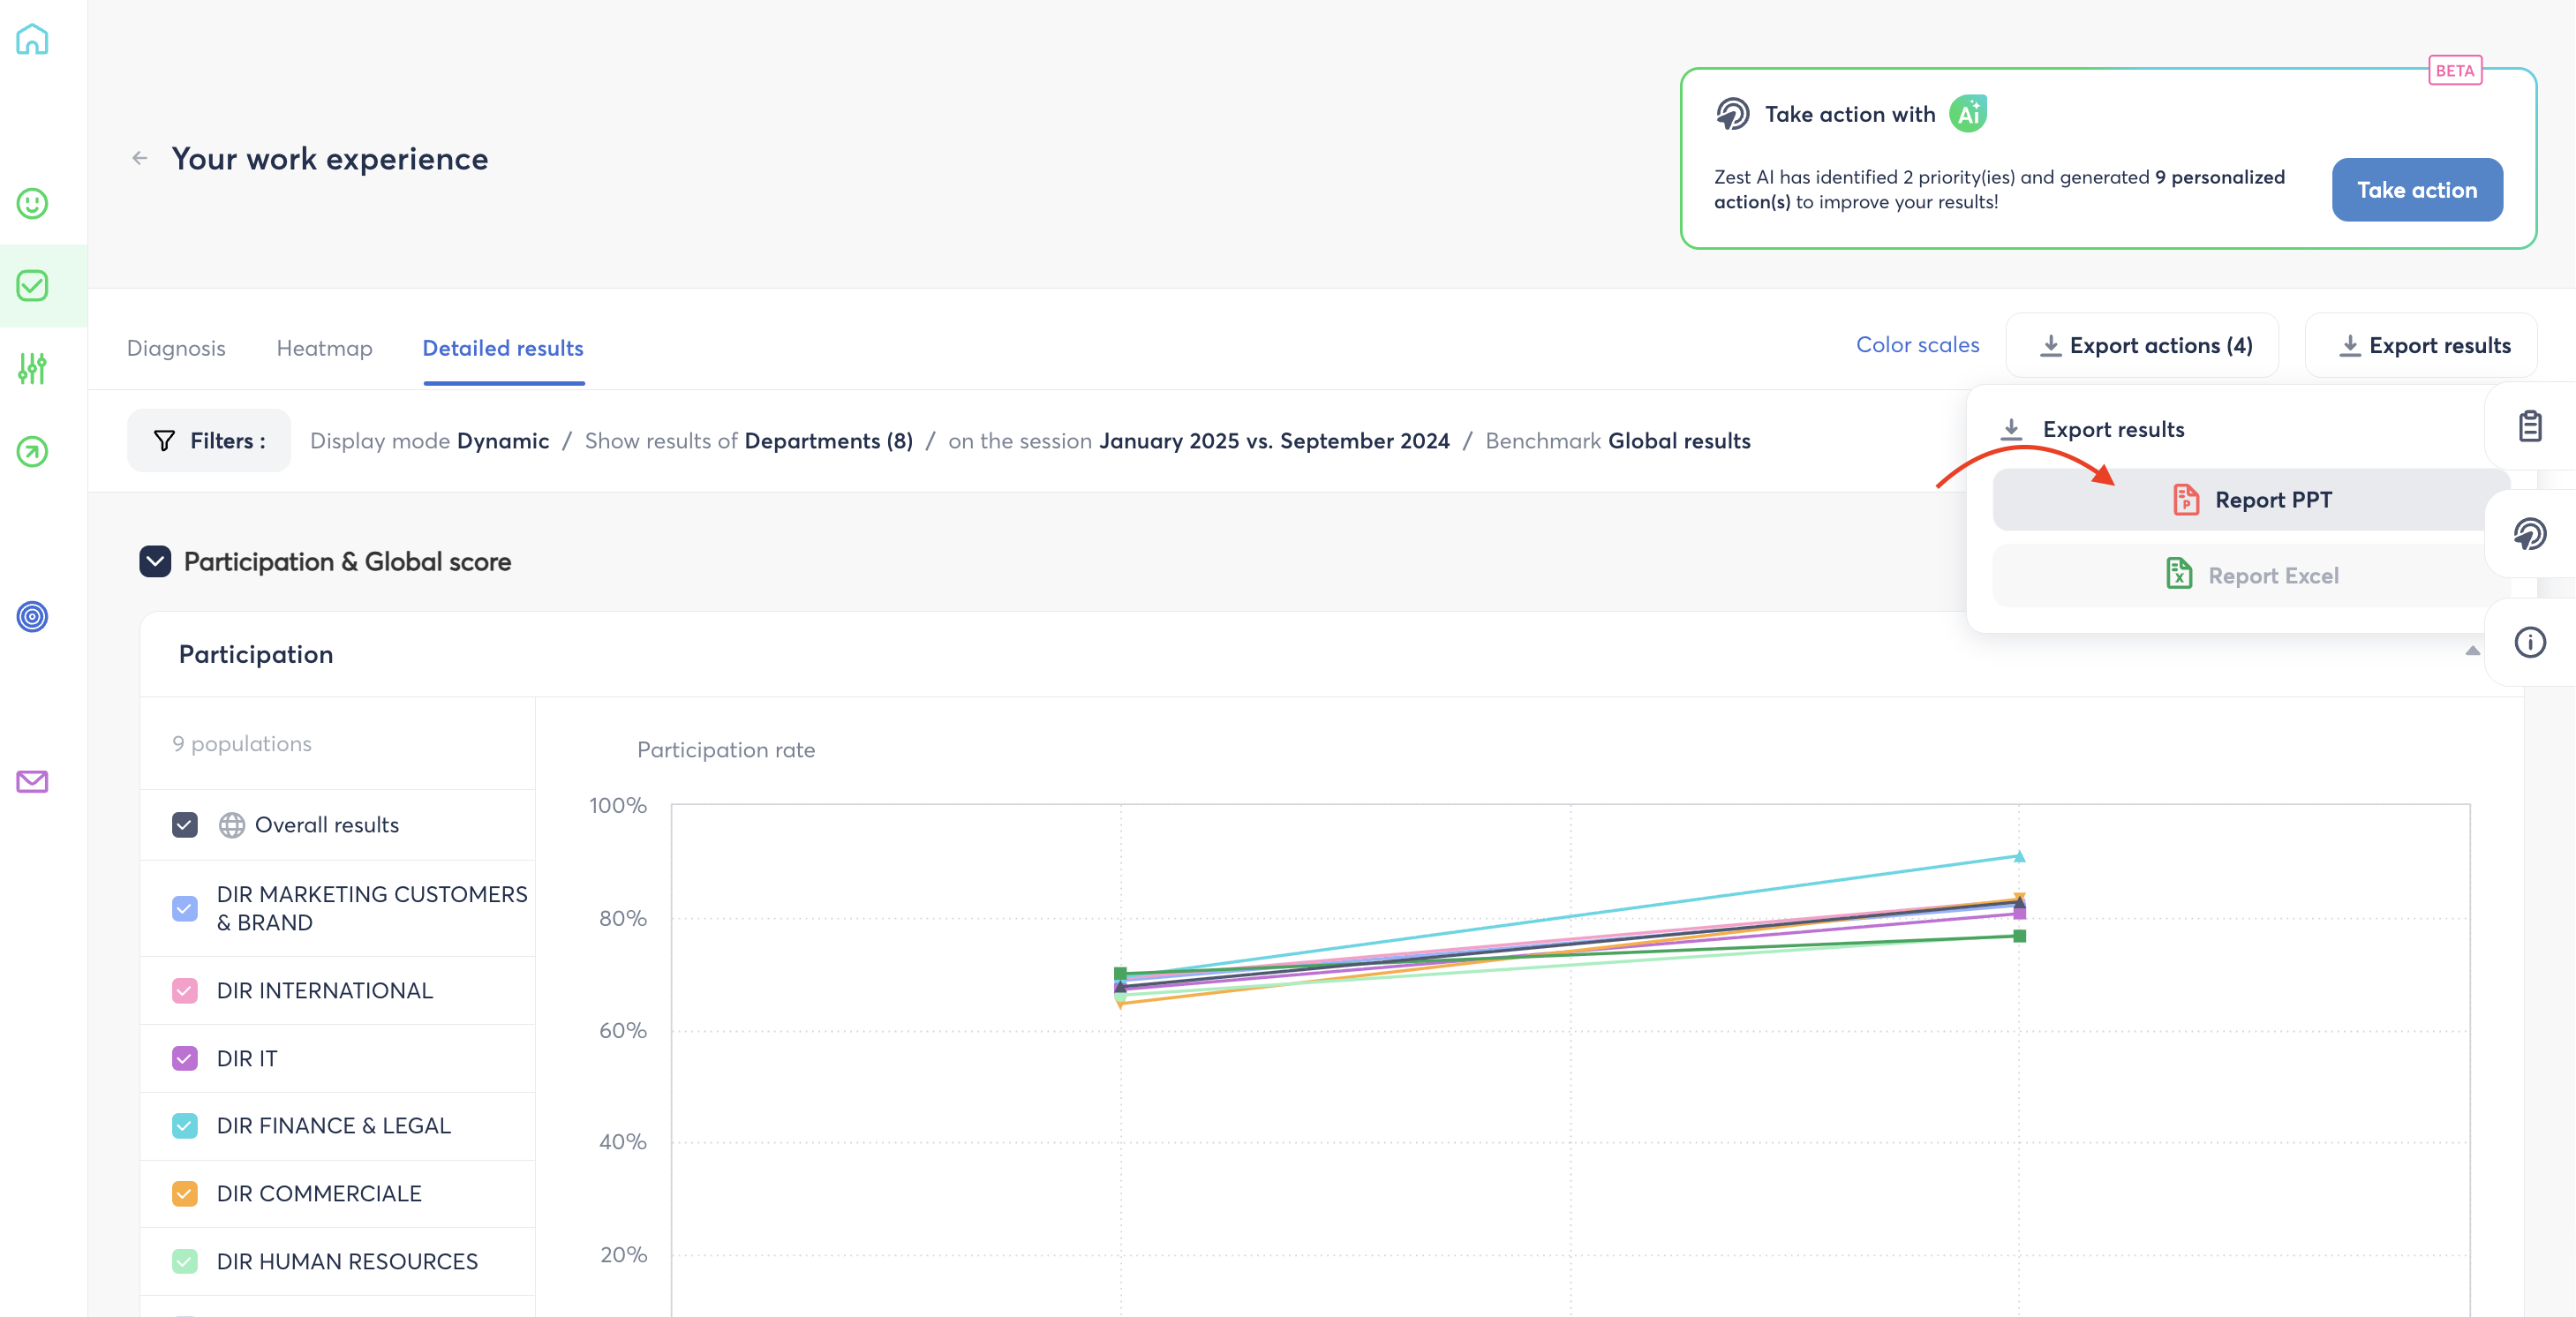
Step 1 – Go to your Survey or Engagement Meter results
- Log in to Zest.
- From the left-hand side menu, go to the Survey or Engagement Meter module.
- Open the session whose results you want to export.
Step 2 – Set your filters before exporting
- On the Detailed Results page, set the filters and comparisons you want to appear in your presentation (department comparison, trend between two sessions, benchmark on your scope, etc.).
- Check the on-screen results preview: this configuration is what will be reflected in the PPT.
Step 3 – Generate the export
- From the Detailed Results page, click Export results > PowerPoint Report.
- Wait while the file is generated.
- Download the PPT file once generation is complete.
💡 Tip: set your filters before launching the export — once the file is generated, it can no longer be edited, and you'll need to run a new export to change the comparison shown.
👉 Going further
👉 To understand in detail the filters and comparisons available in results analysis, see the article: How to compare results between several groups?
👉 To learn more about setting up your survey's themes, see the article
💬 Sensitive comments export
Zest also allows you to export respondents’ sensitive verbatims.
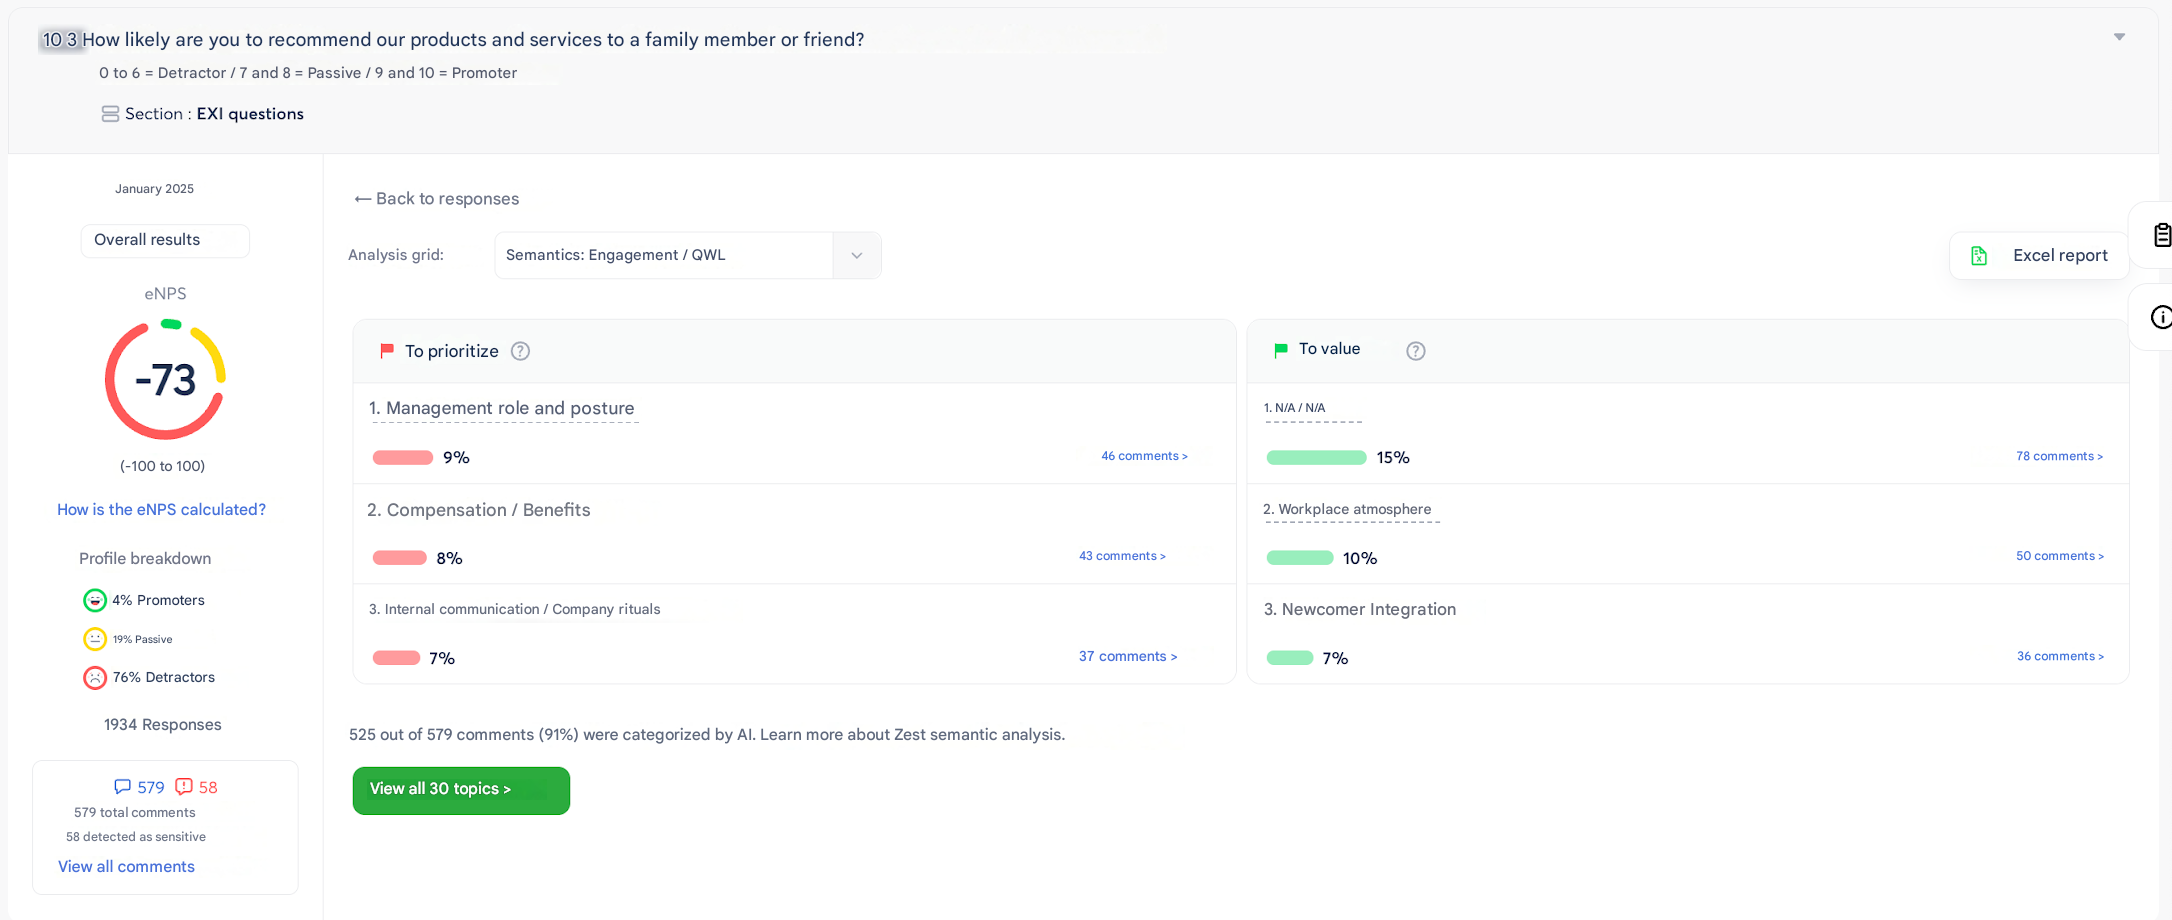
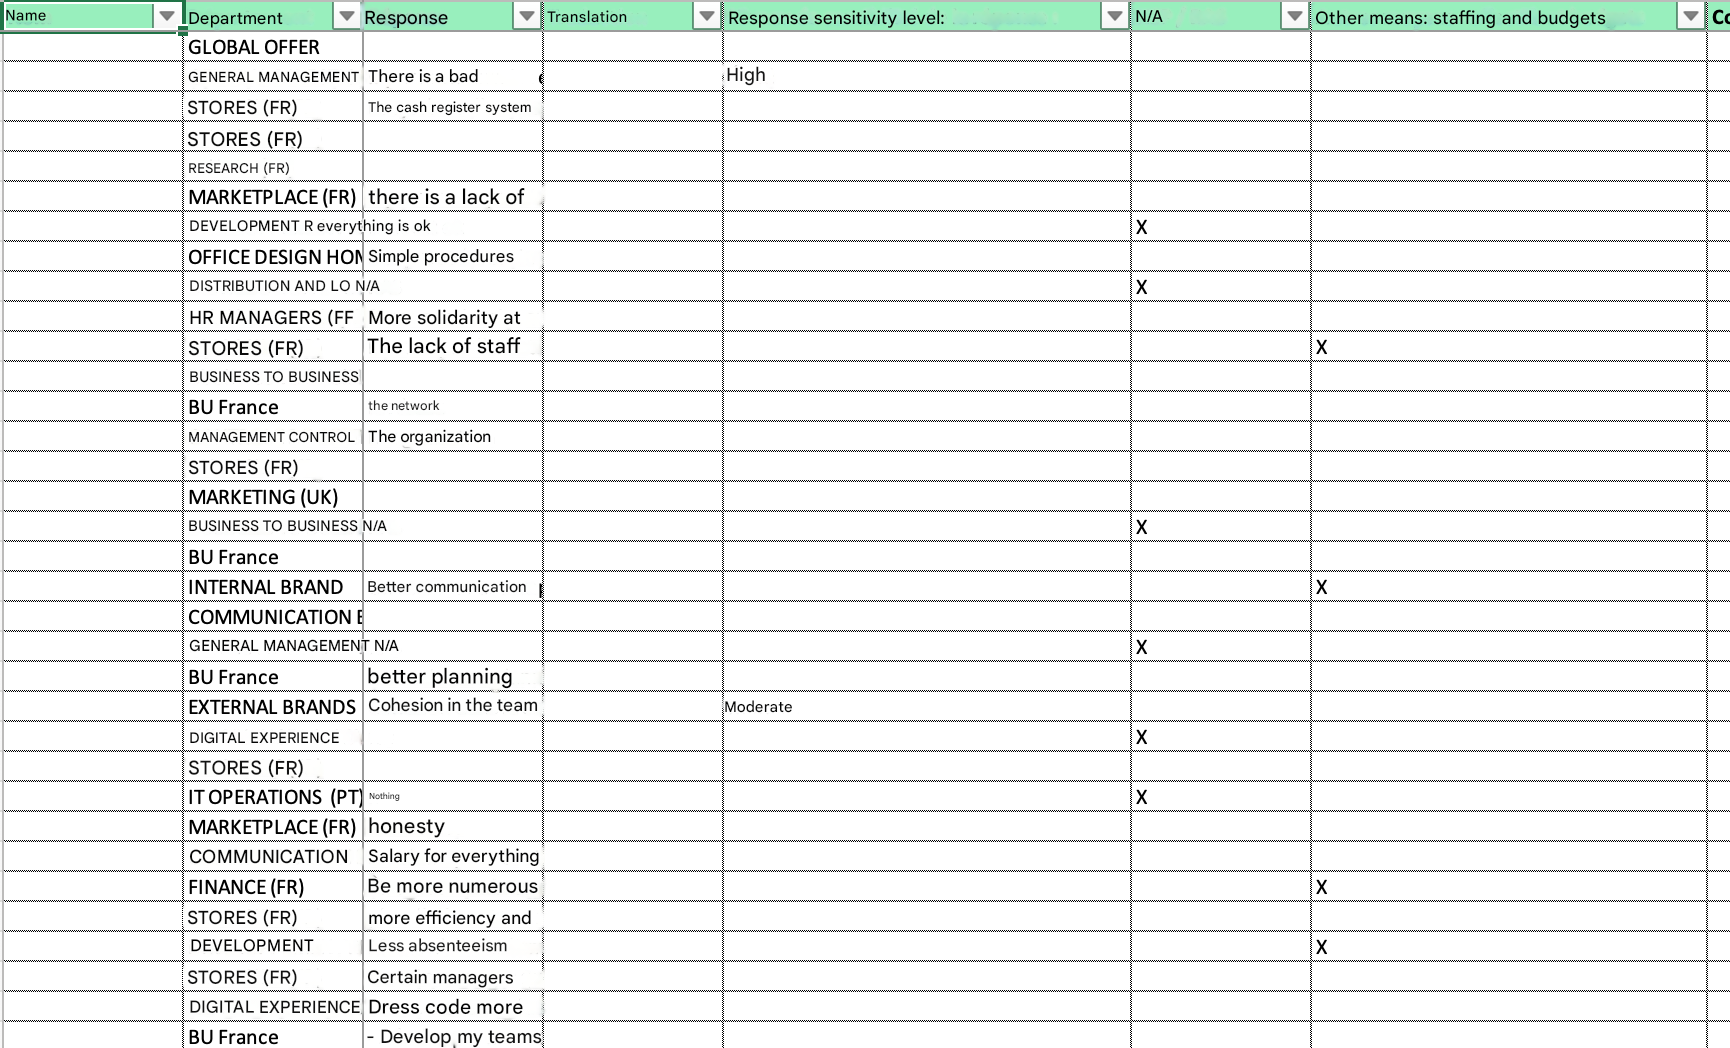
The file contains 2 tabs:
- Consolidated view:
- Groups comments according to their sensitivity level
- Displays the associated sentiment (positive / neutral / negative)
- Includes recurring survey results if applicable
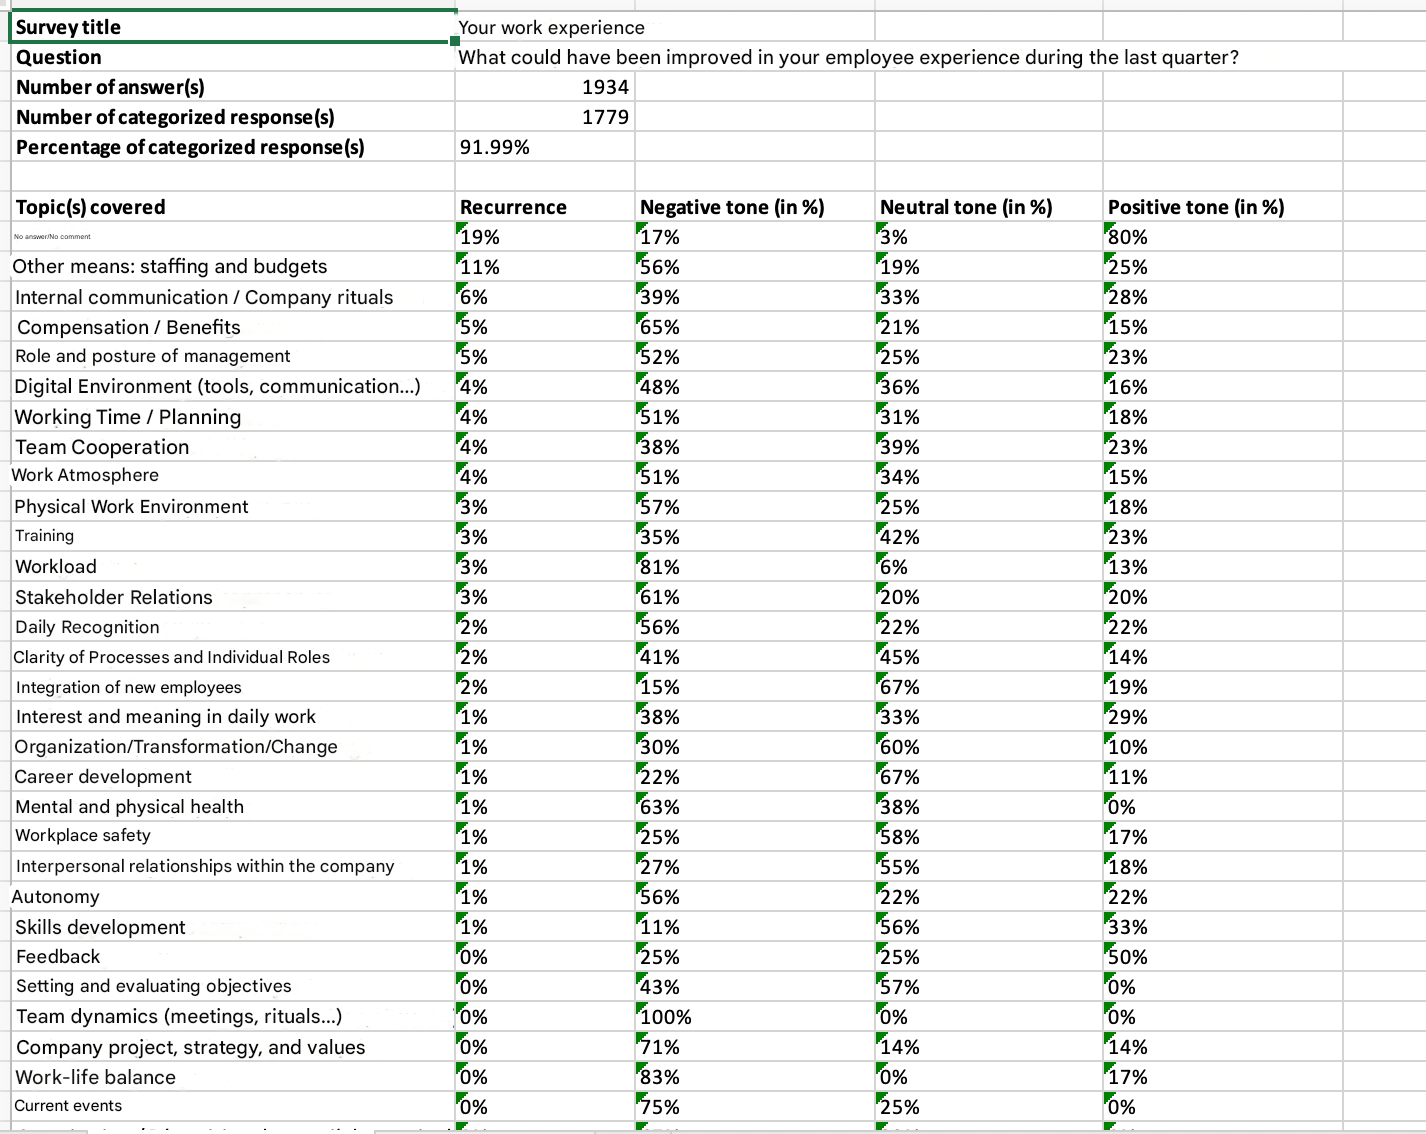
Detailed view:
- Complete list of verbatims
- Identified sensitivity level
- Attributes (if available)
🧮 Export from the Heatmap
From the Evolution > Heatmap tab, you can export a full replica of the heatmap.
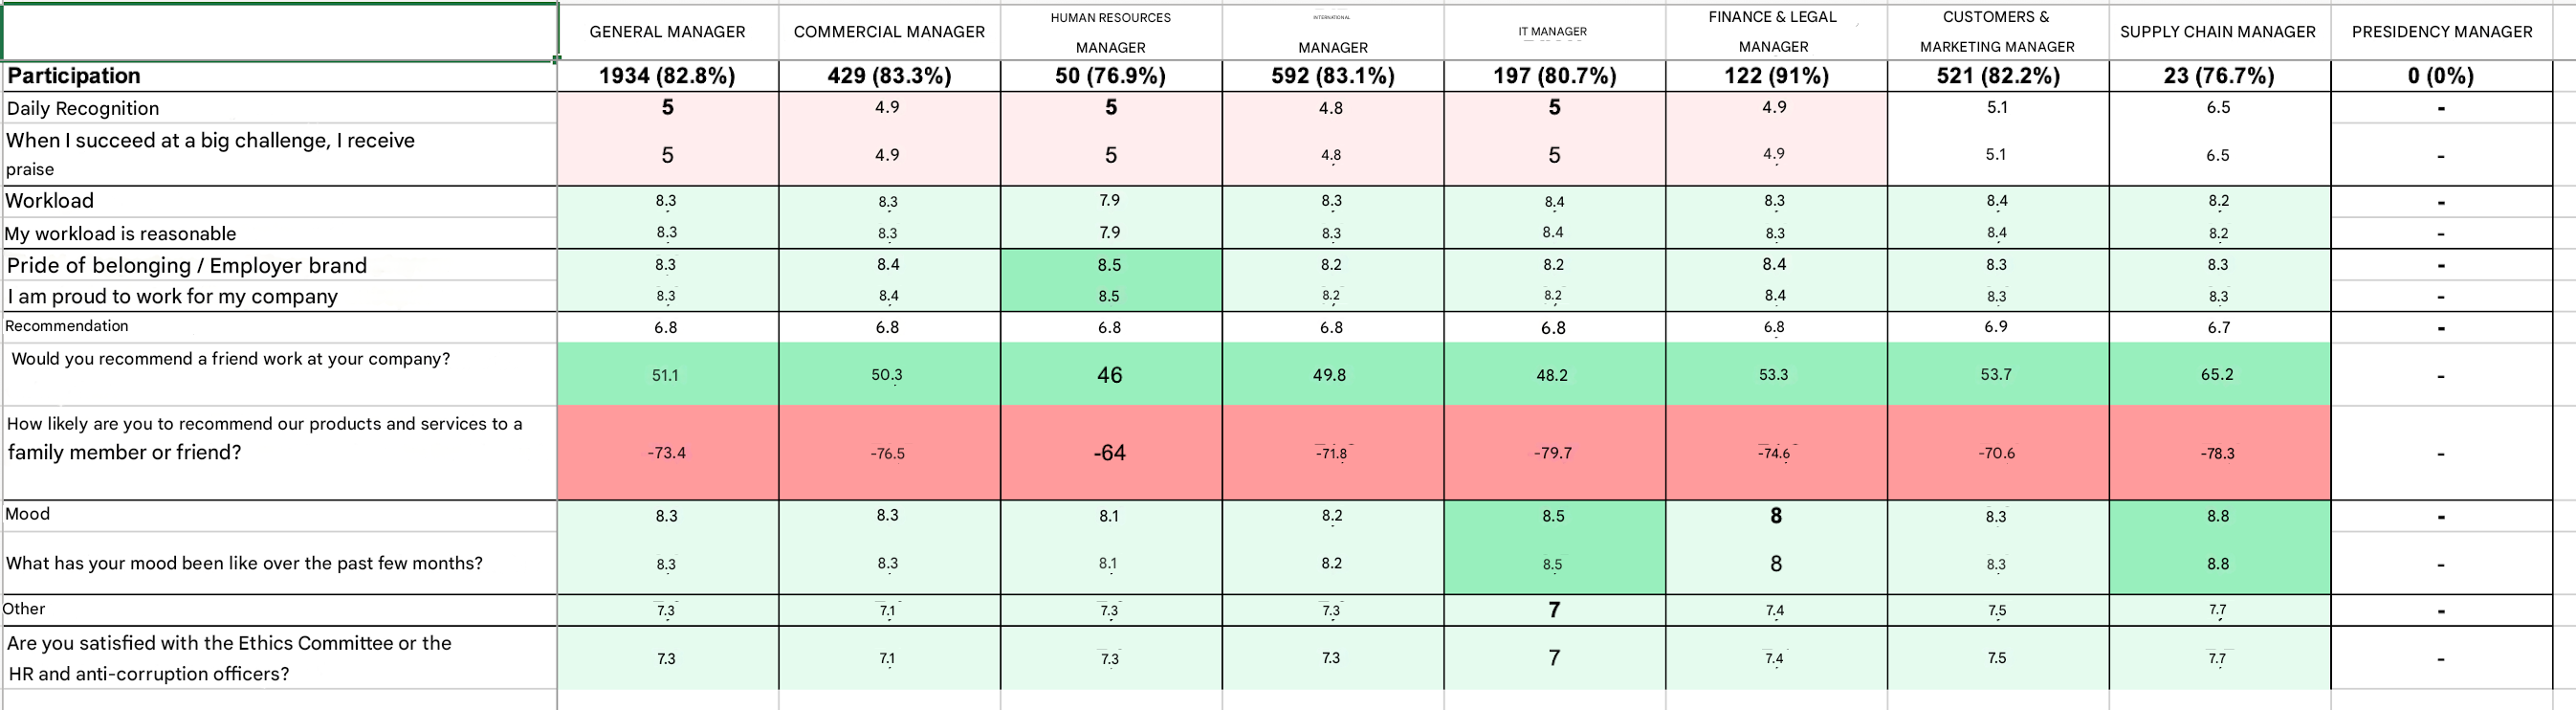
The export contains 3 tabs:
- Score: average result by group and by question
- Evolution: comparison of scores over time
- Delta: positive or negative variations from one session to another
📌 Info:
This format is ideal for analyzing trends, comparing populations, or feeding your QWL and People Review reports.