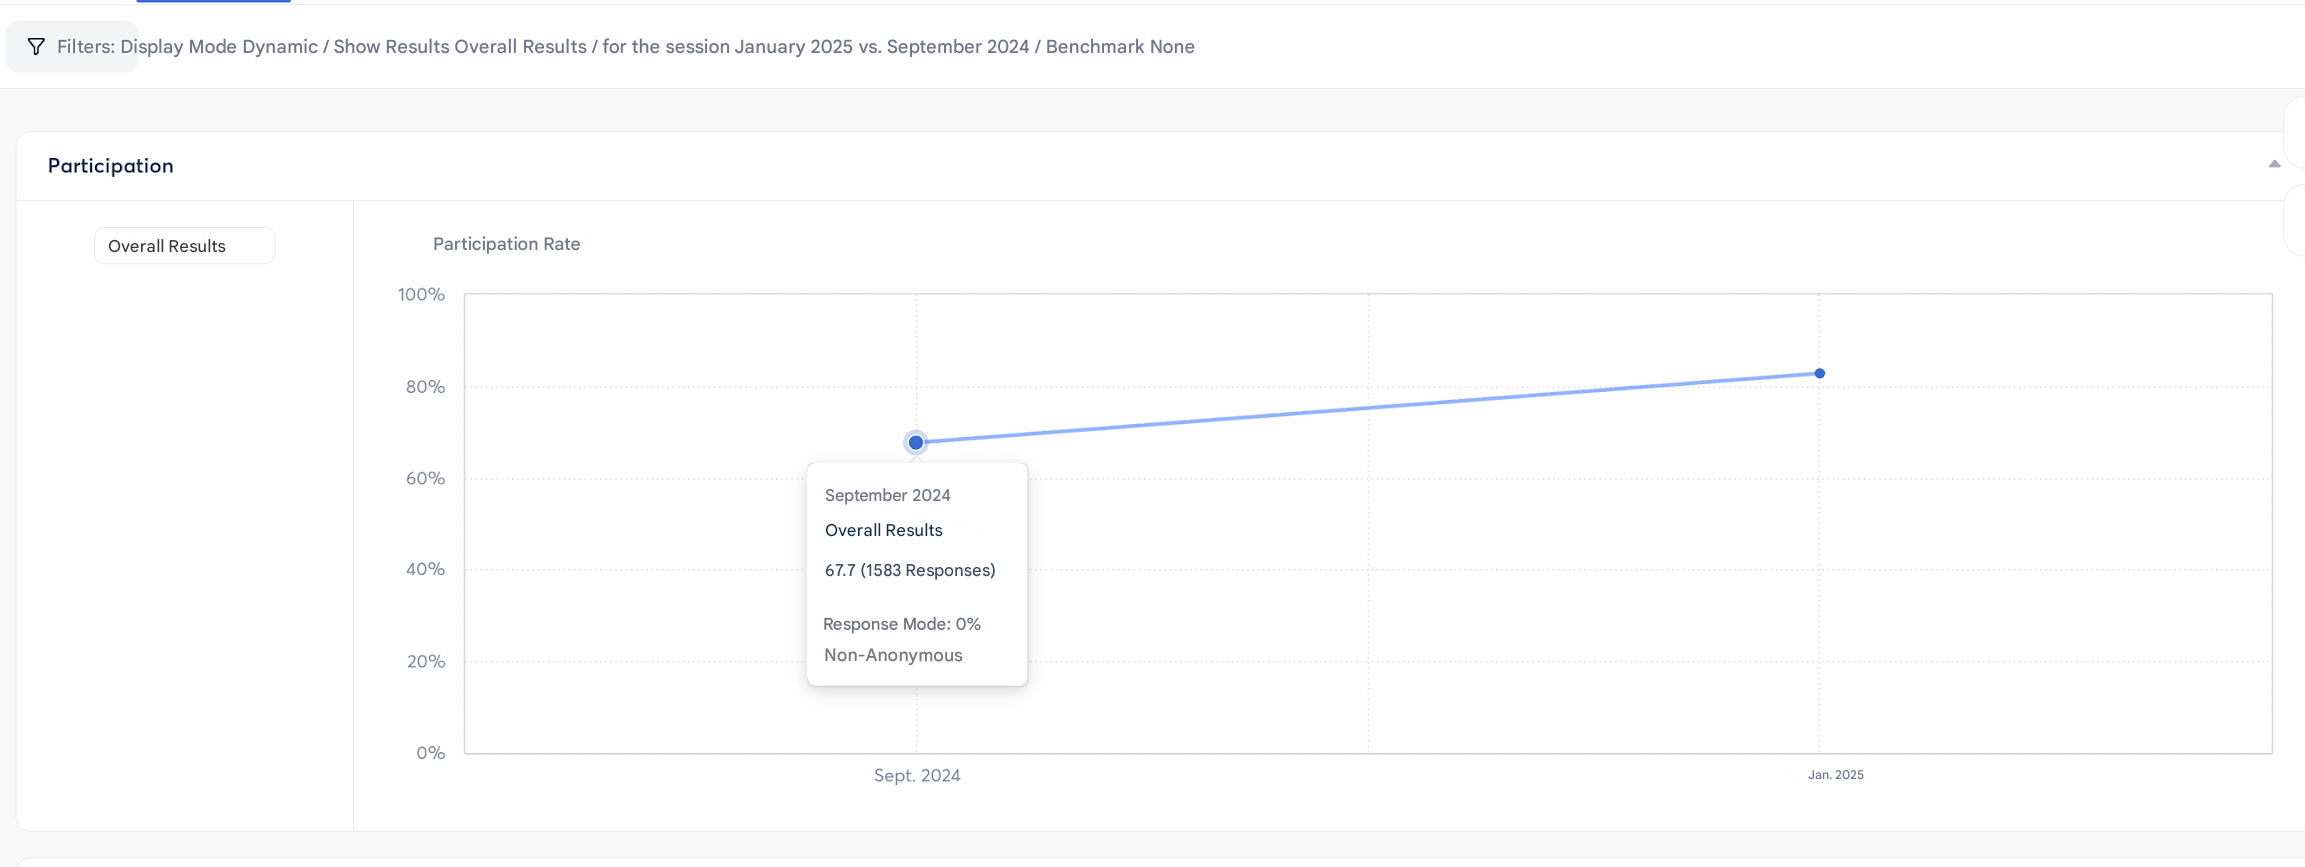
📈 Compare survey results
Once a survey is launched, the analysis of responses depends on the visibility permissions defined when the survey was created (see configuration in the Create tab).
👁️ Visibility by role
The survey Creator can configure access to results according to roles:
- Managers: access results for their scope
- Owners, Contributors, and Administrators: access overall results
- Users: see only their own response and the overall averages, if configured
📌 Info:
By default, the analysis screen displays the results for the user’s scope (team, department, etc.).
🧭 Available filters
To refine the analysis, you can use the following filters:
- Departments
- Locations
- SmartGroups
- Managers
- Custom attributes
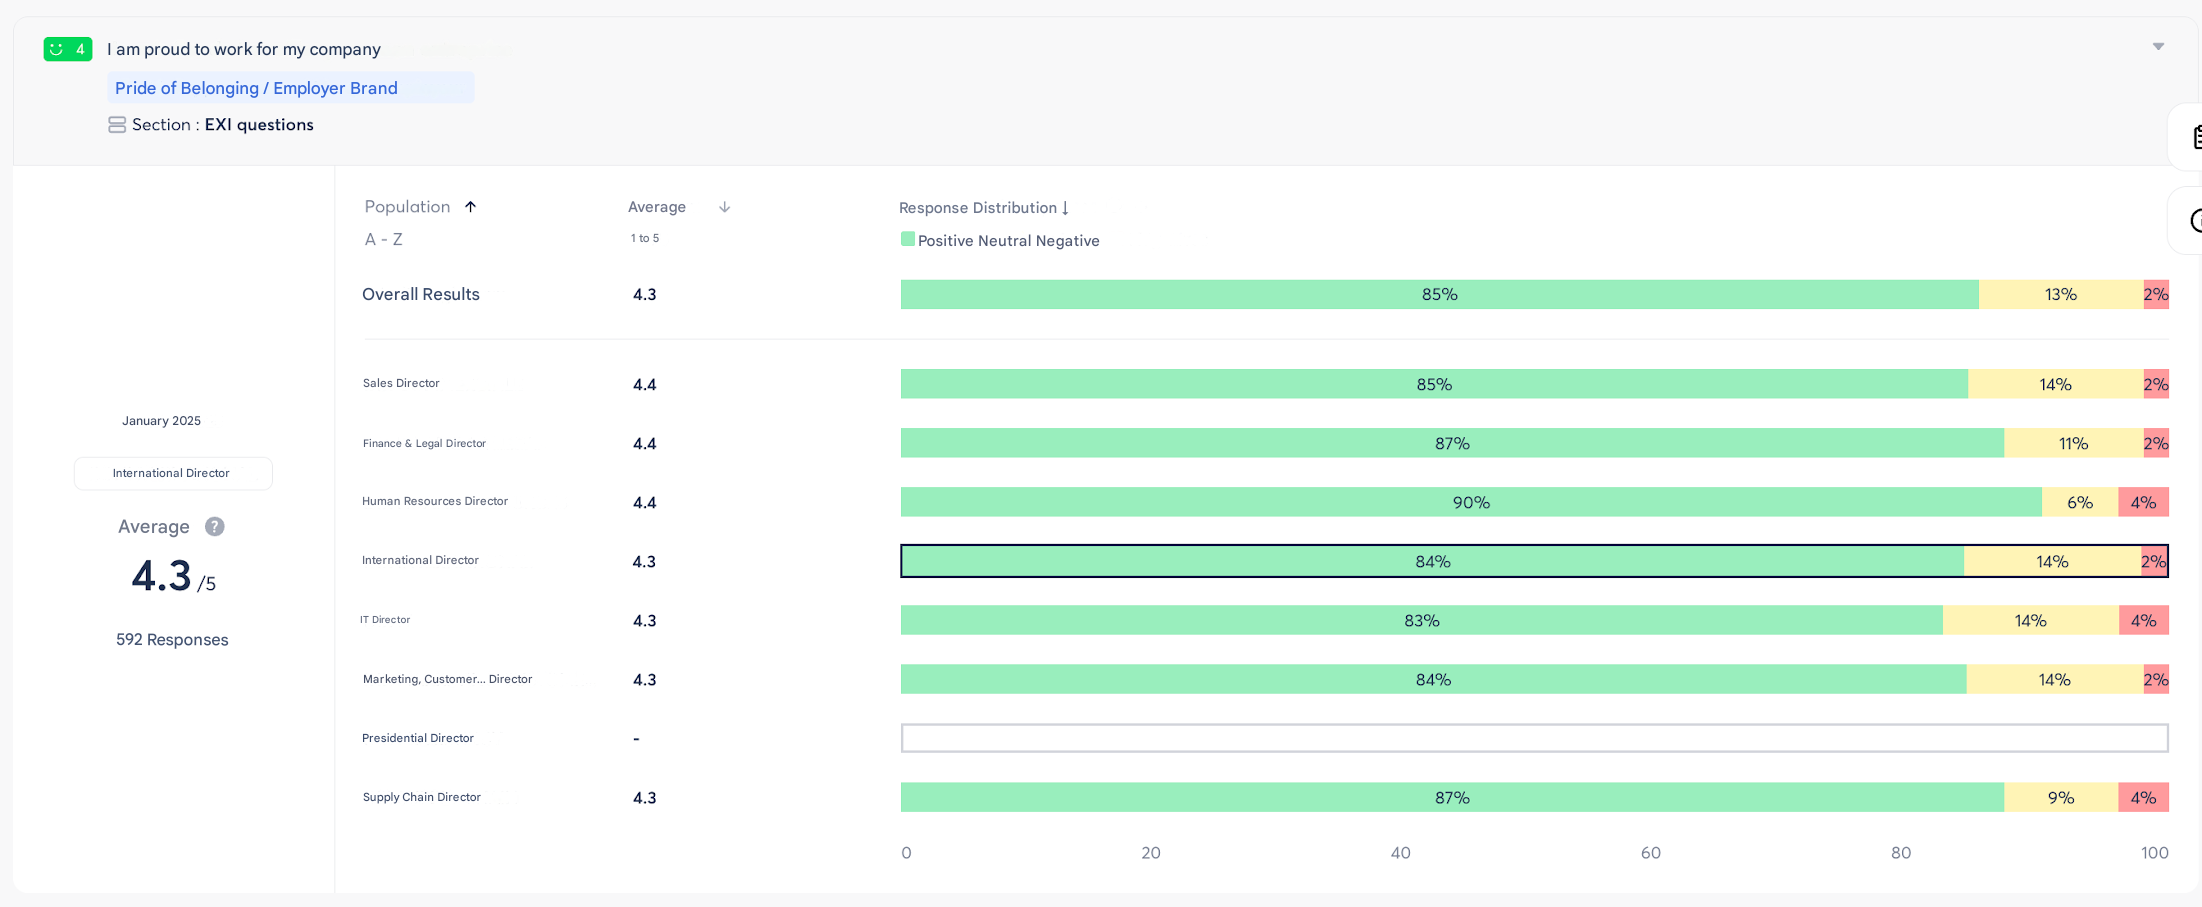
📊 Multi-group comparison
It is possible to compare up to 15 units with each other.
To do this:
- Go to Filters
- Go to “View consolidated results for the following populations”
→ The selected filters will apply here
- Click “Customize selection”
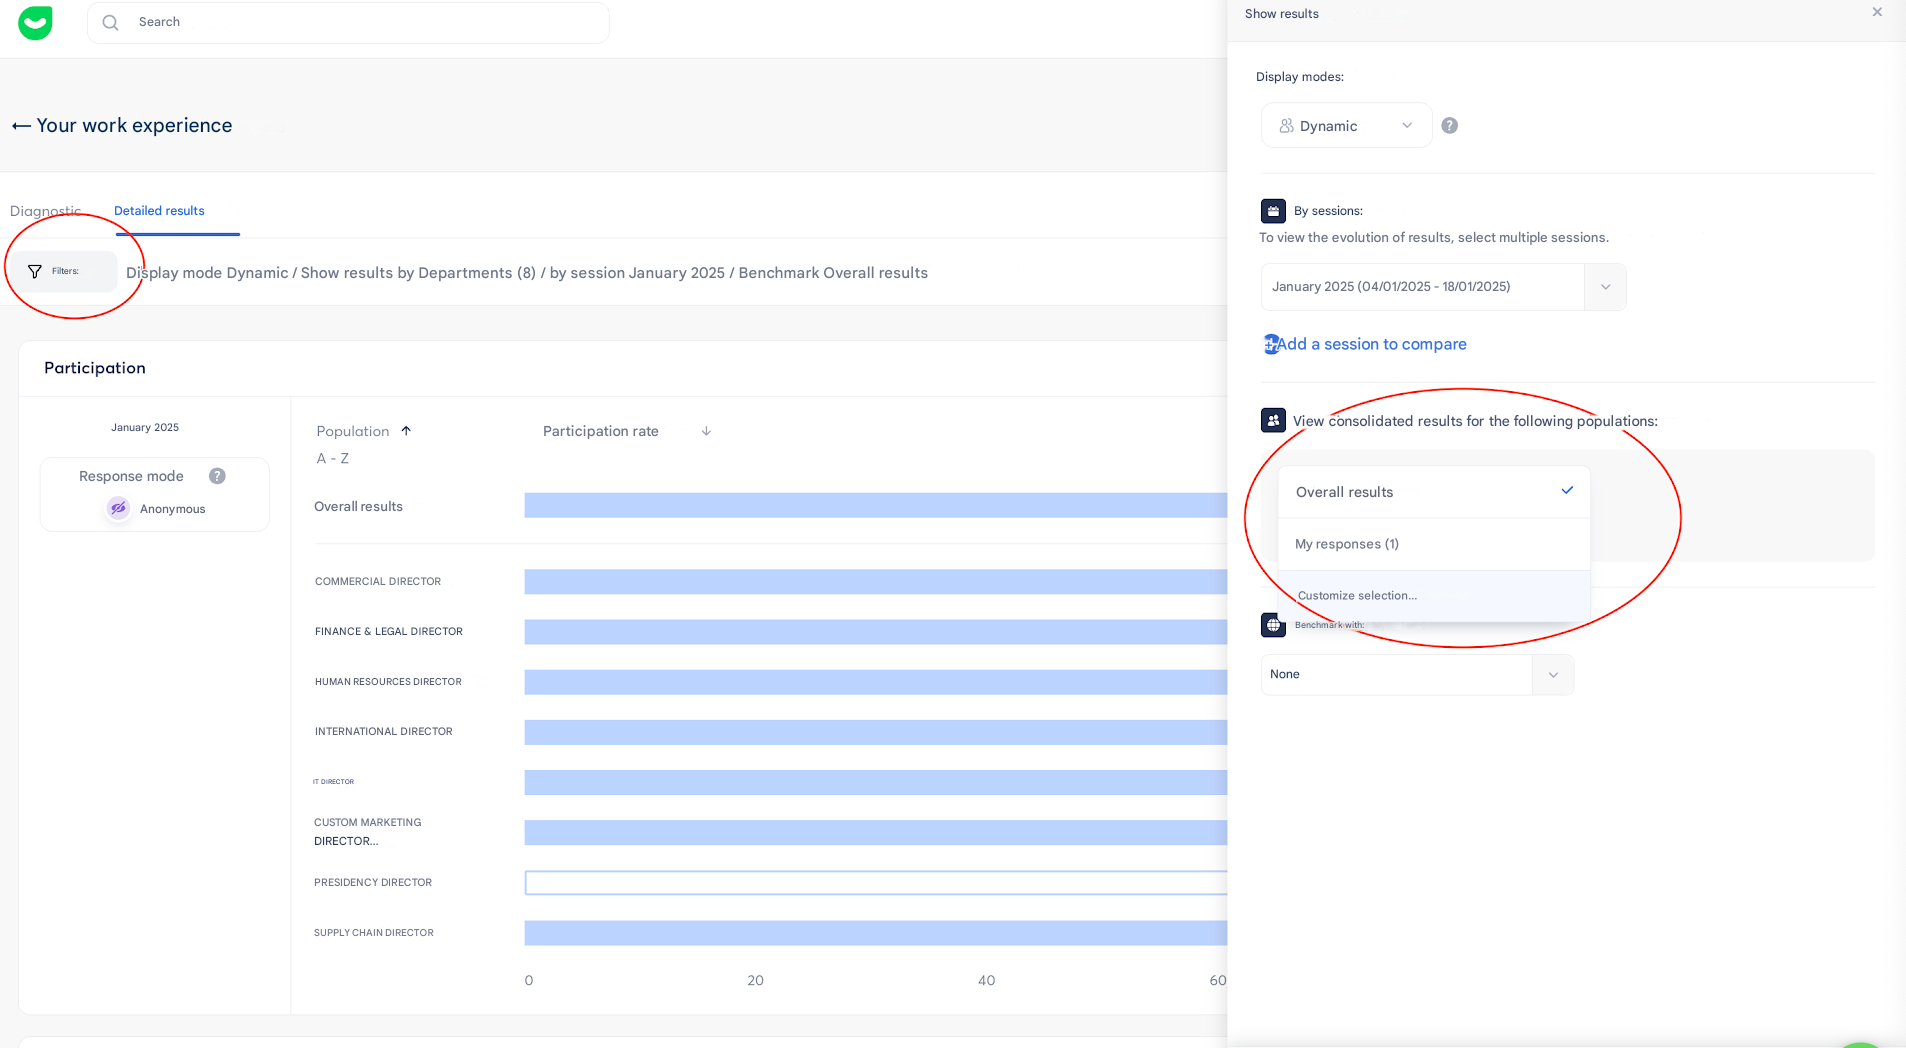
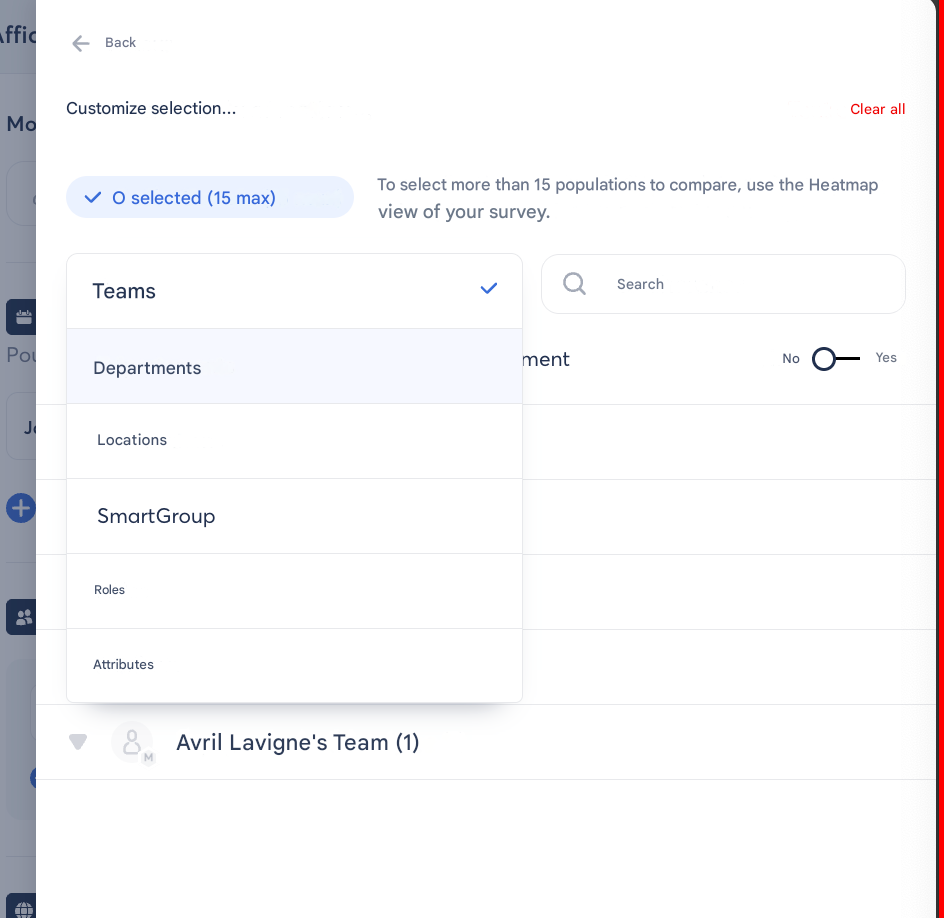
- Choose the groups you want to compare (e.g.: Department)
- Depending on your SmartOrg, select the departments you are interested in
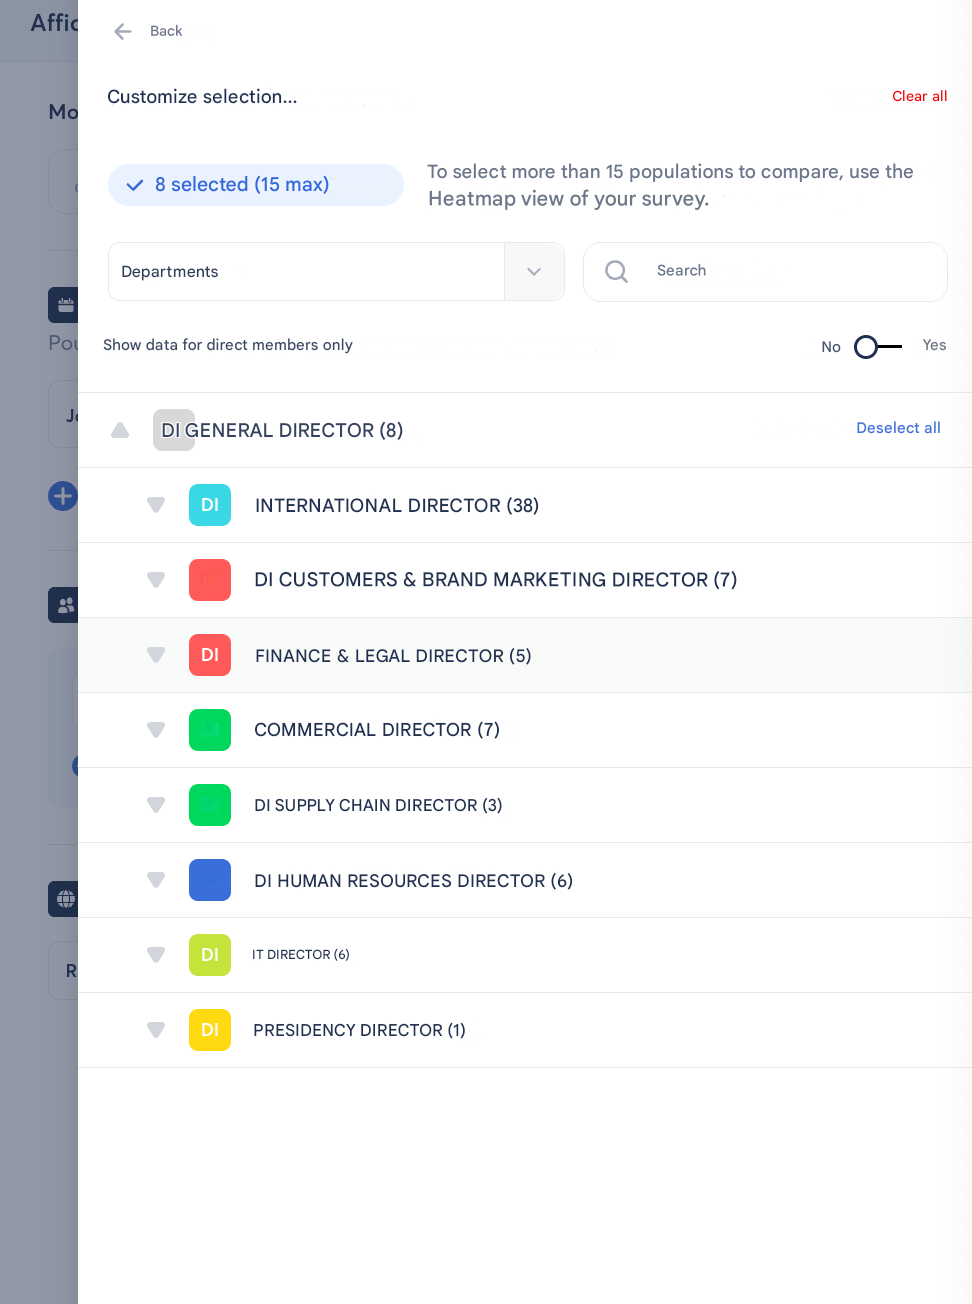
The comparative results will then be displayed automatically.
💡 Tip:
This feature is useful for comparing different teams, sites, or entities with each other on the same question.
⏱️ Details on recipients and response rate
⚠️ Warning: in recurring surveys, the displayed figures may vary depending on when they are viewed.
| Element | Definition | Where is it displayed? |
|---|---|---|
| Recipients | Number of Employees currently in the selected scope | At the top of the analysis (dynamic screen) |
| Response rate | Number of people who received the survey at launch, regardless of later changes | In the charts (value fixed at sending) |
📌 Example:
If a survey was sent to 71 people, but one user has since been deleted, the response rate will remain based on 71, while the displayed number of recipients may show 70.