🔁 Track the evolution of results in a recurring survey
In Zest, it is possible to create recurring surveys in order to track the evolution of responses over time. This helps identify team dynamics, trends, and weak signals to monitor.
📆 Create a recurrence
When creating a survey, you can define an automatic frequency from the following options:
- Monthly
- Quarterly
- Semi-annual
- Annual
📌 You can also manually add new sessions to an existing survey if you want to keep a history without defining a fixed frequency.
📈 Two ways to analyze evolution
Once several sessions are available, Zest offers two complementary ways to analyze the evolution of responses.
📊 Compare results with a previous session
To view the evolution compared with previous surveys:
- Go to Filters
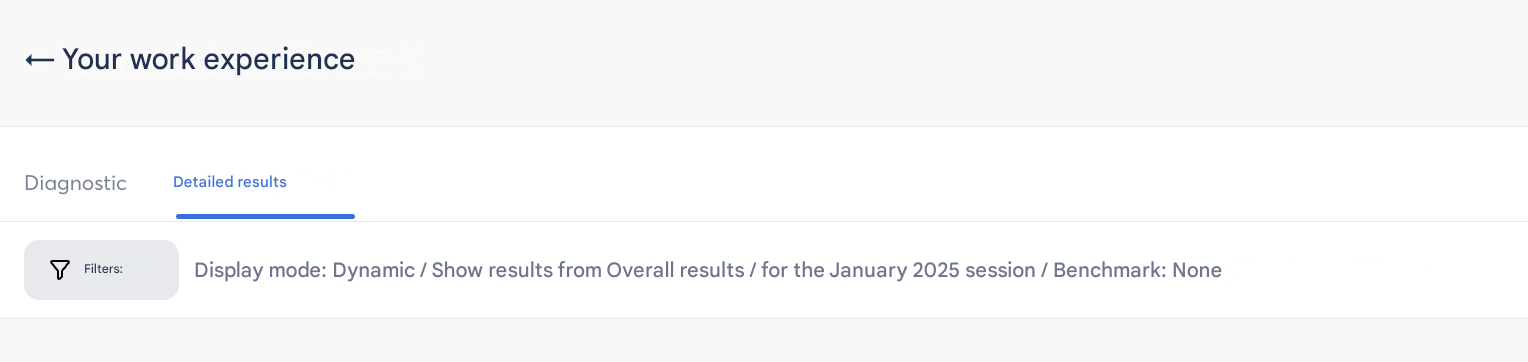
- Click “Add a session to compare”
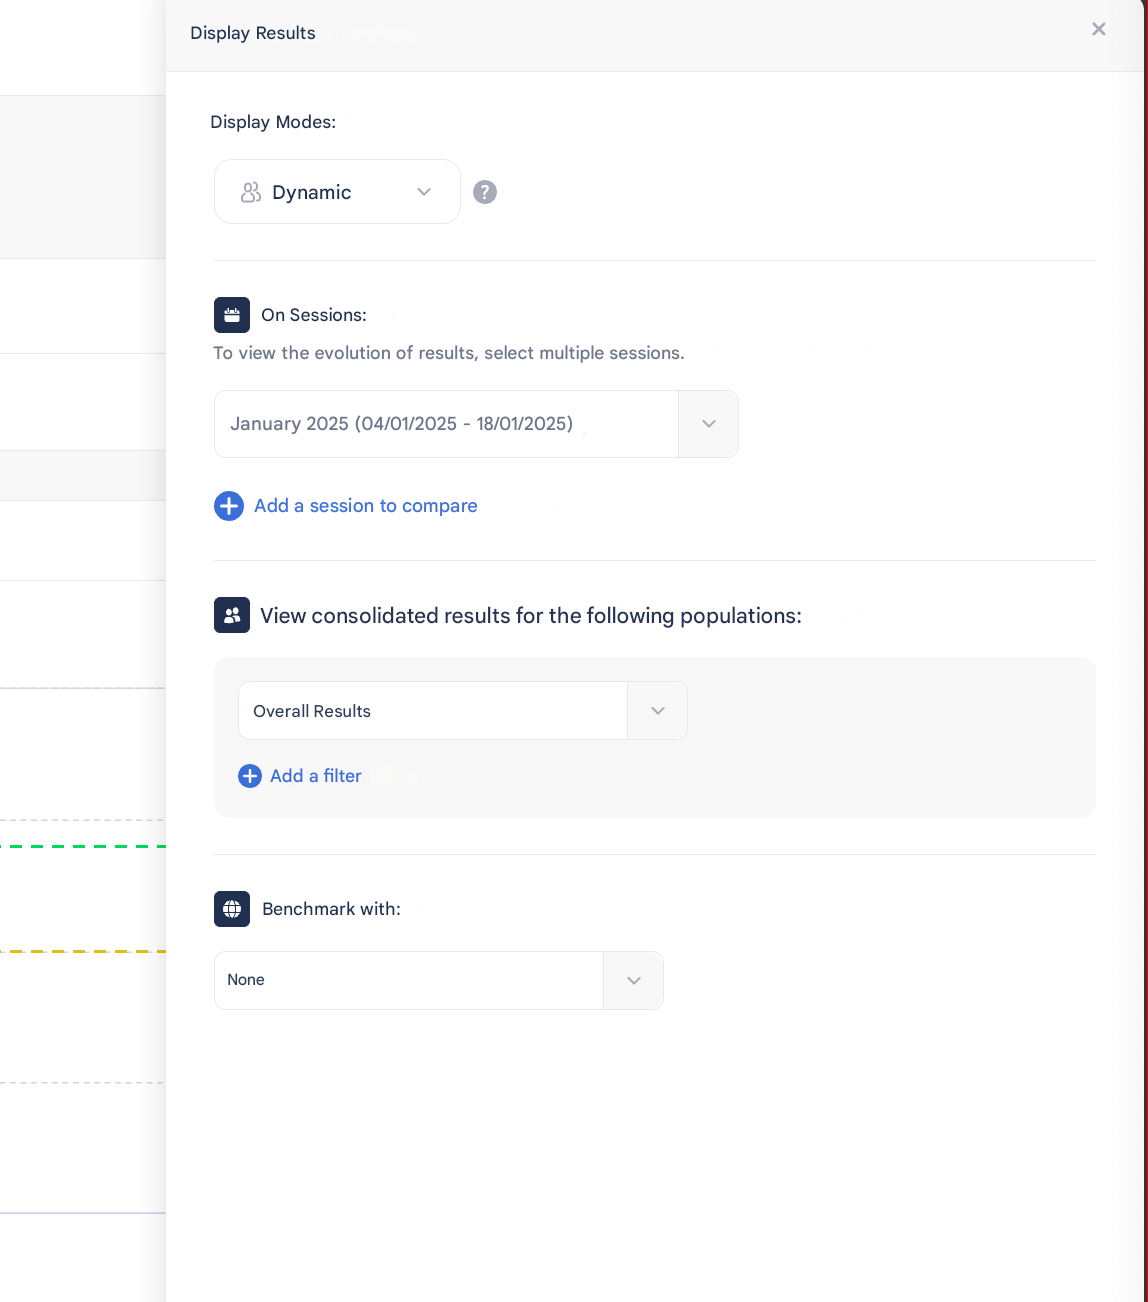
- Select the desired session
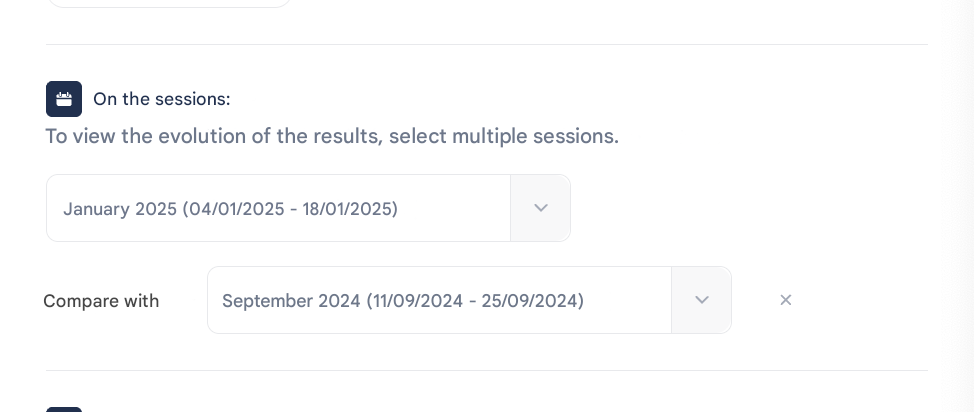
- Click Apply filters
You can then view the evolution tracking directly in the results.
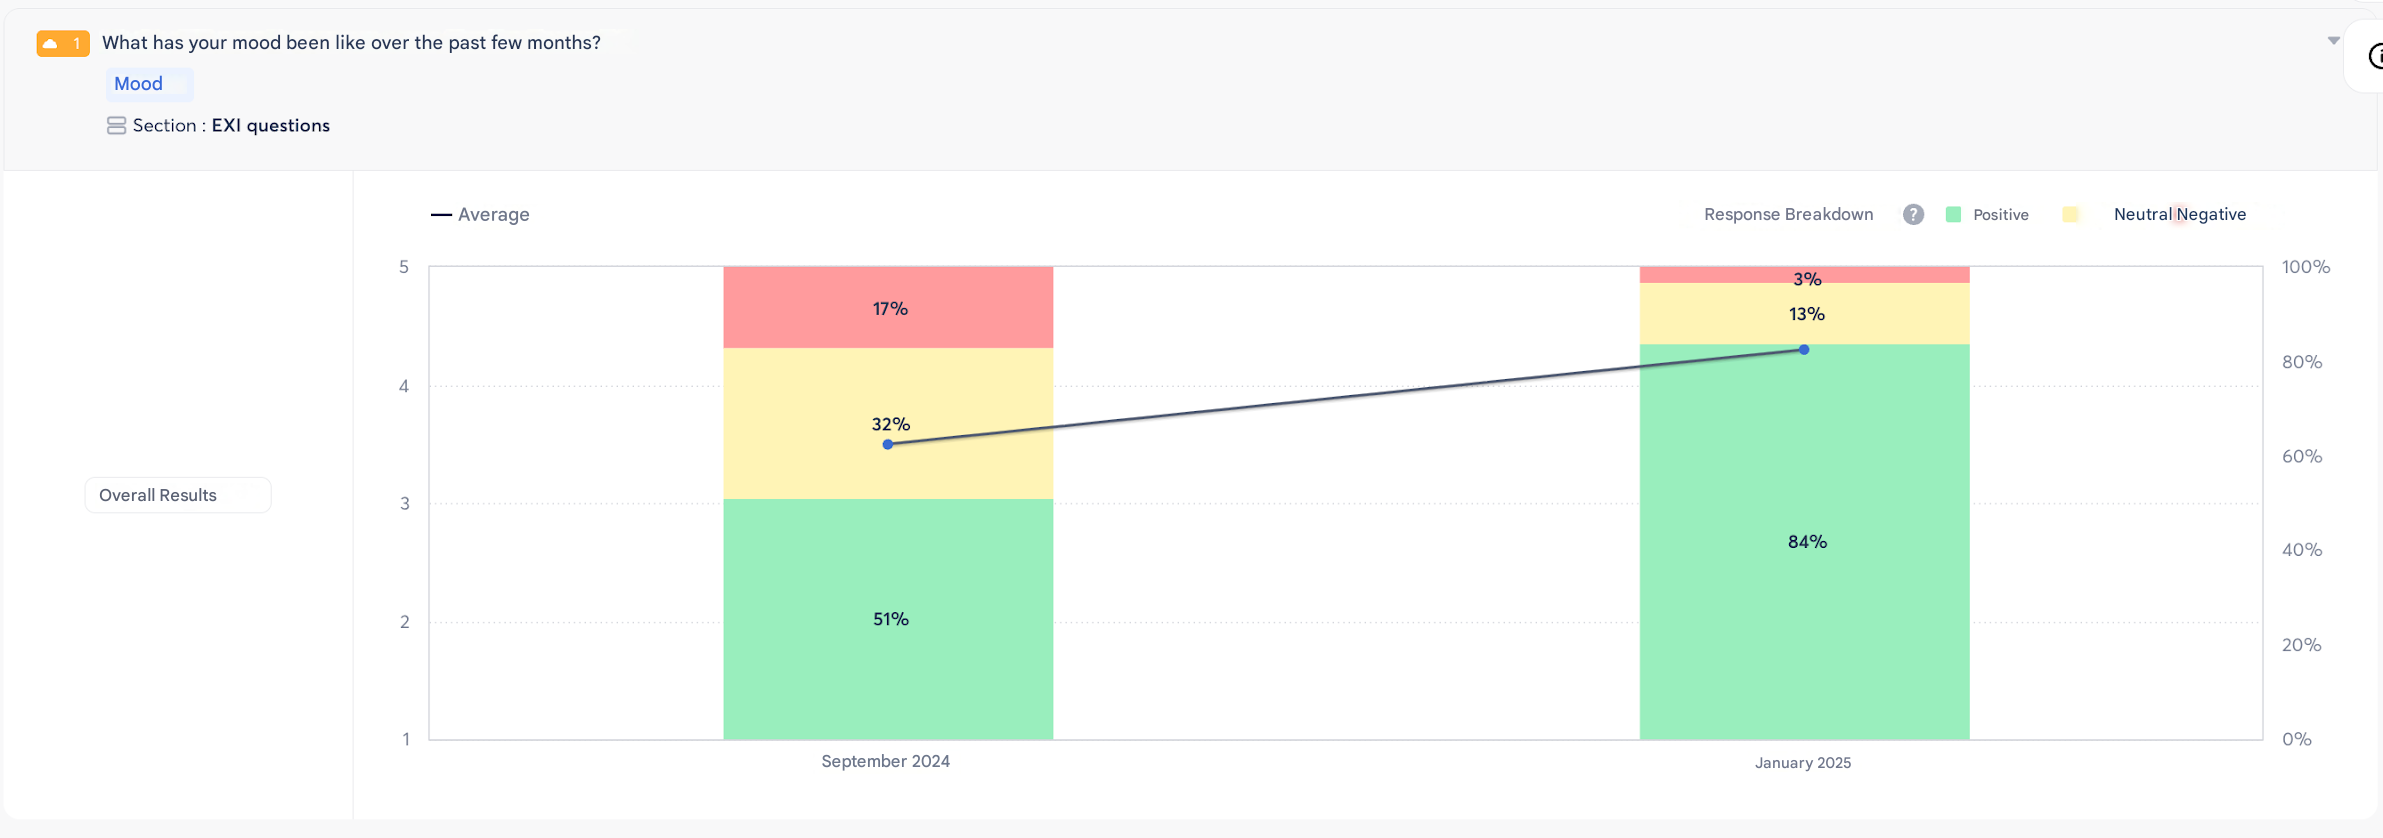
✅ What you can do:
- View the graphical evolution of each question across sessions
- Identify upward or downward trends
- Easily switch from one question to another through the interface
⚠️ Limit to know:
Free-text questions are not available in this evolution view.
2️⃣ Global analysis - Heatmap view
In the “Evolution” tab, you can access a comparative heatmap of the different survey sessions.
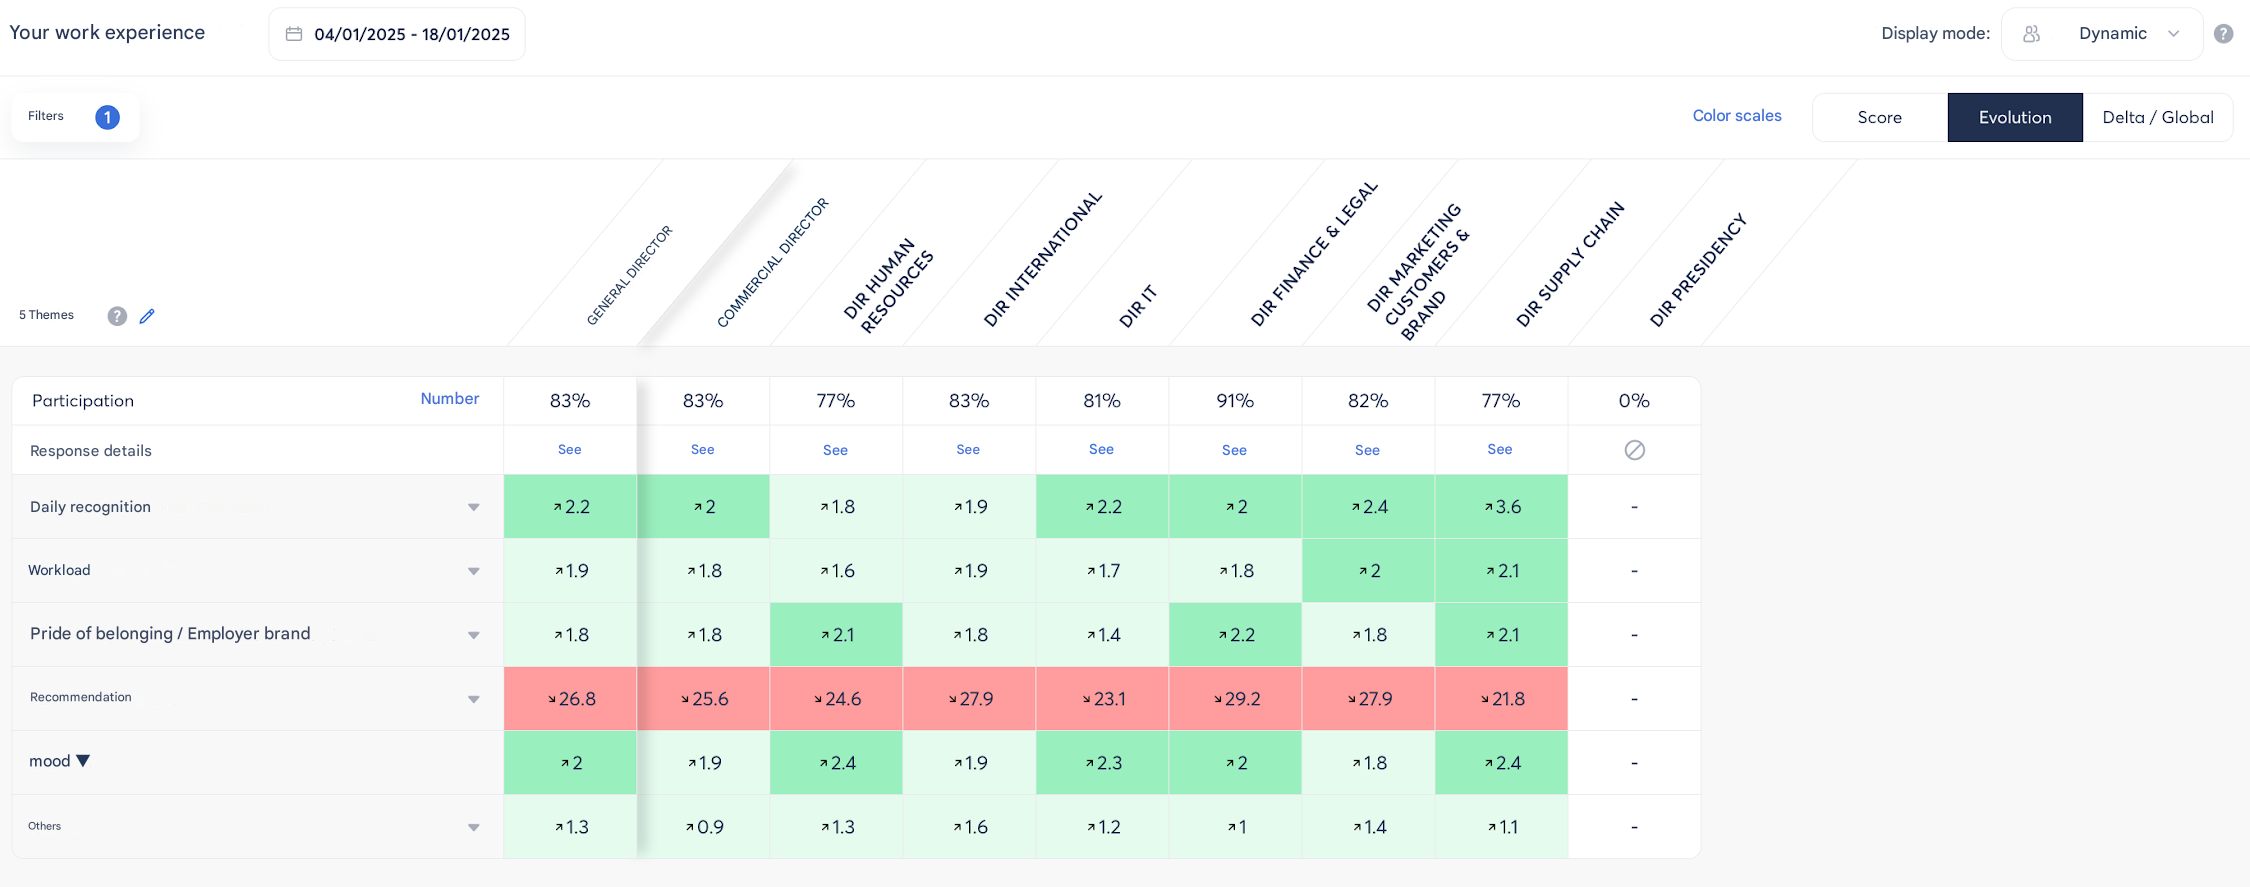
✅ What you can do:
- See at a glance the average evolution of each question
- Spot improvements or declines by color
- Identify stable or sensitive topics
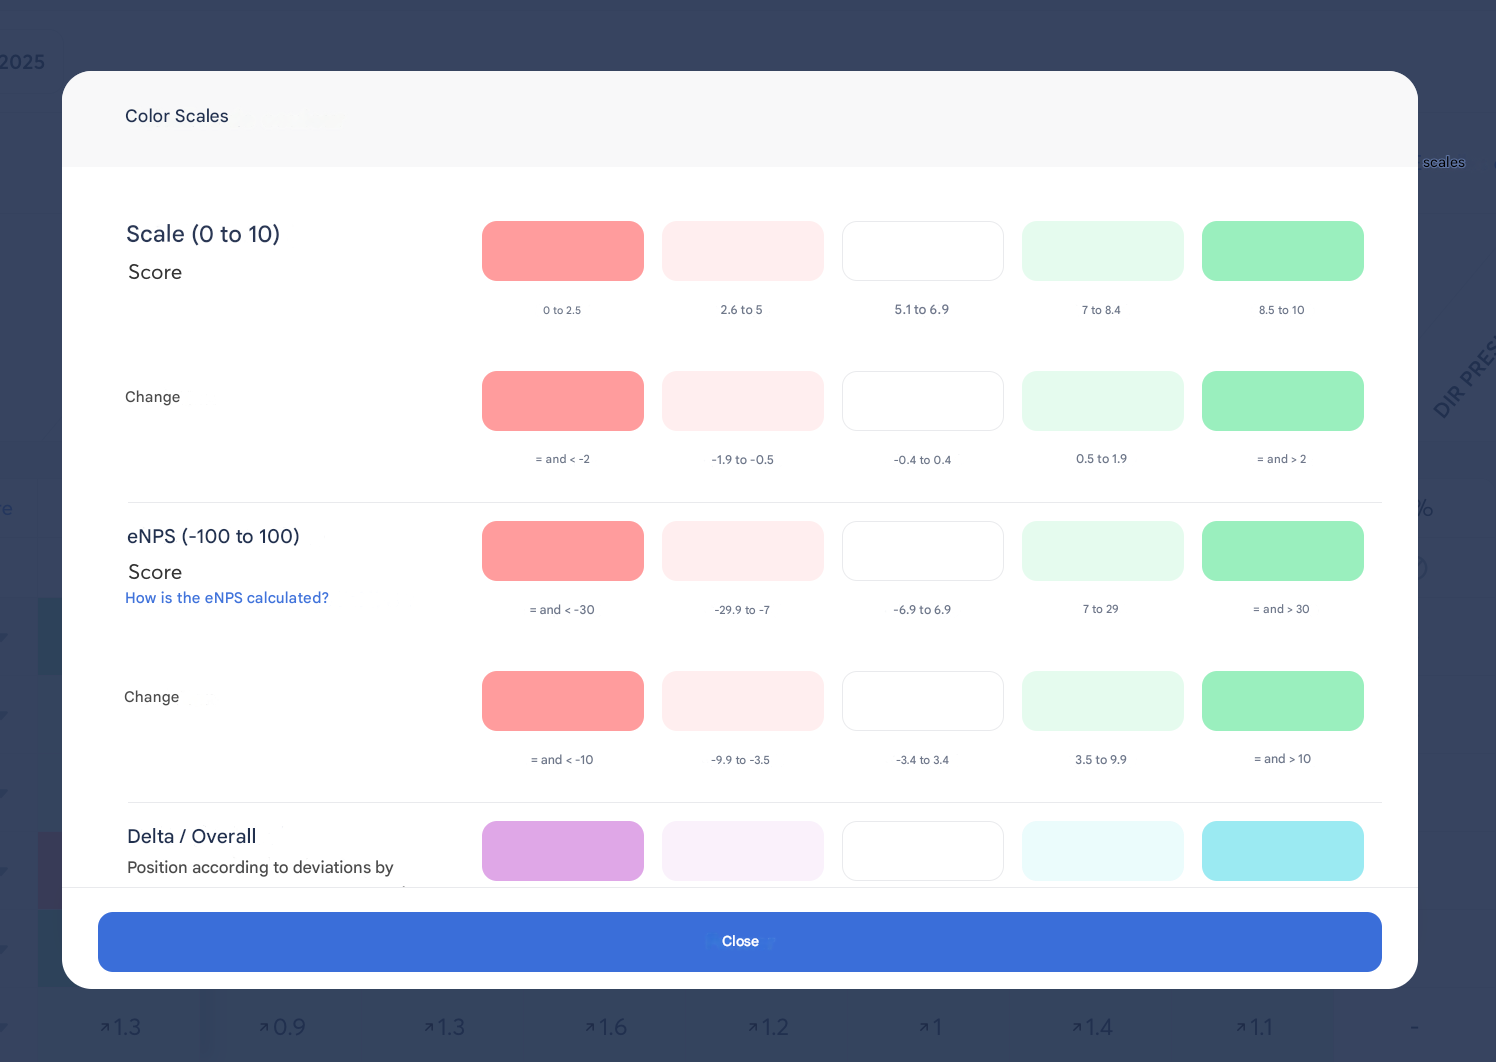
💡 Color legend available
A color scale allows you to quickly interpret the results (progression / stagnation / regression).
🎛️ Available filters for targeted analysis
Whether you use the question view or the heatmap, you can apply dynamic filters to refine your analysis:
- By department
- By location
- By SmartGroup
- By custom attributes
💡 This allows you to compare the evolution of results across different groups or internal populations.