🌟 Heatmap & Benchmark
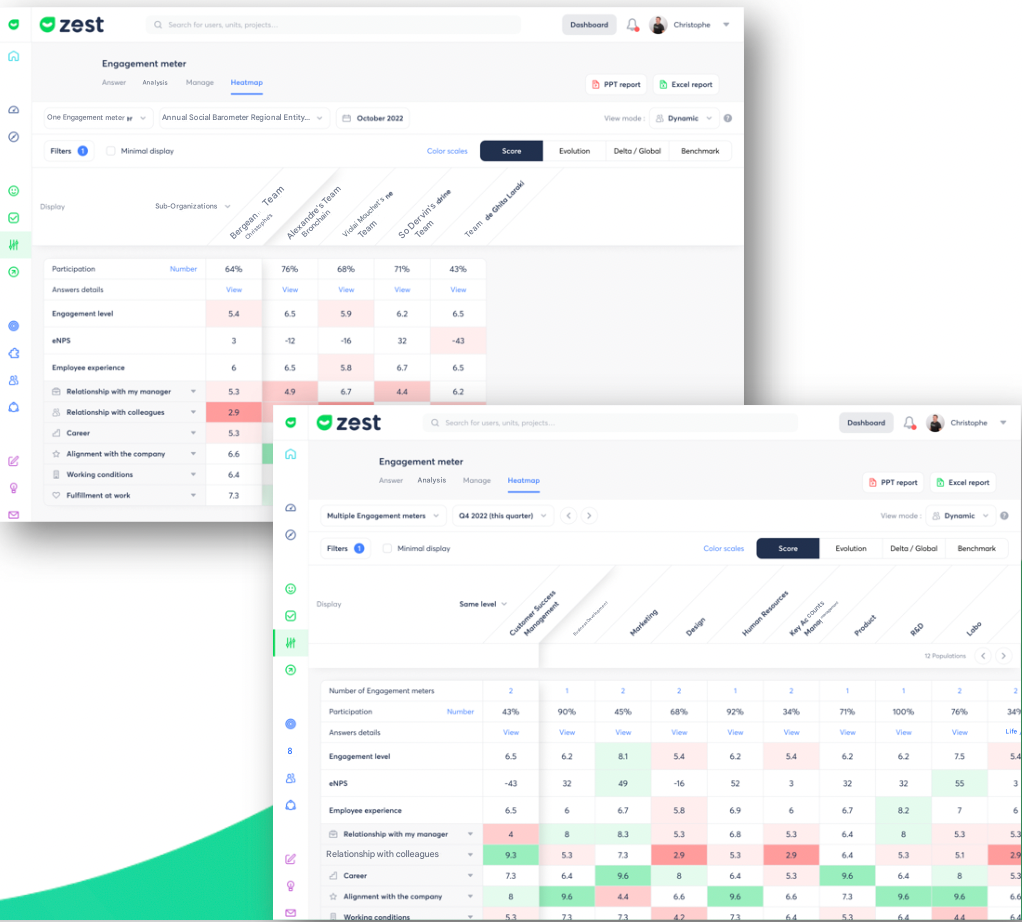
The Heatmap allows you to compare Engageometer scores across different organizations and visualize results from different perspectives.
🗂️ The 4 available tabs
- Score: distribution of scores in a Heatmap format.
- Evolution: progress compared to the previous equivalent session or period.
- Delta / Global: score differences and positions in quartiles compared to the company’s median scores.
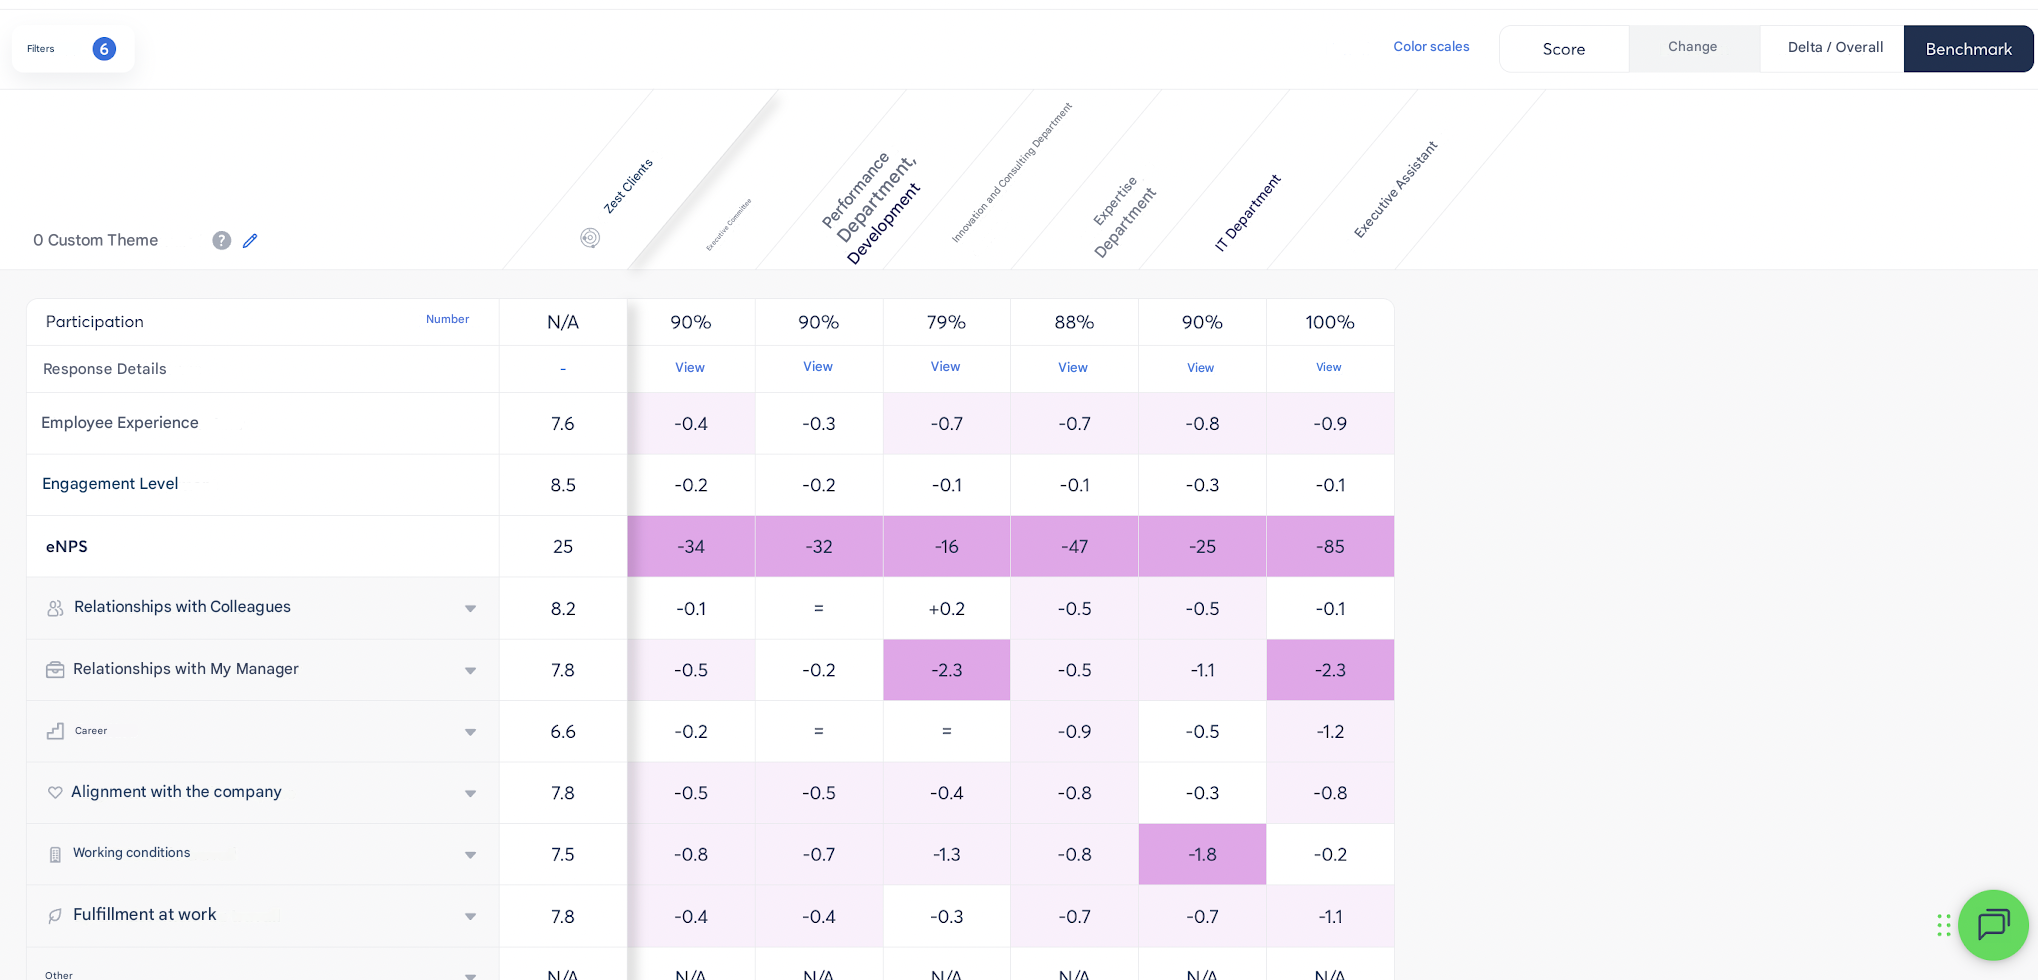
- Benchmark: external comparison with median scores of Zest clients.
✨ Benchmark sources:
- Client data accumulated over the last 12 months.
- Updated every 6 months.
⚠️ For this first version, no filtering by industry or company size is available
🔥 Heatmap
- Questions from a Custom framework are not included (not standardized and therefore not comparable).
📊 Benchmark tab
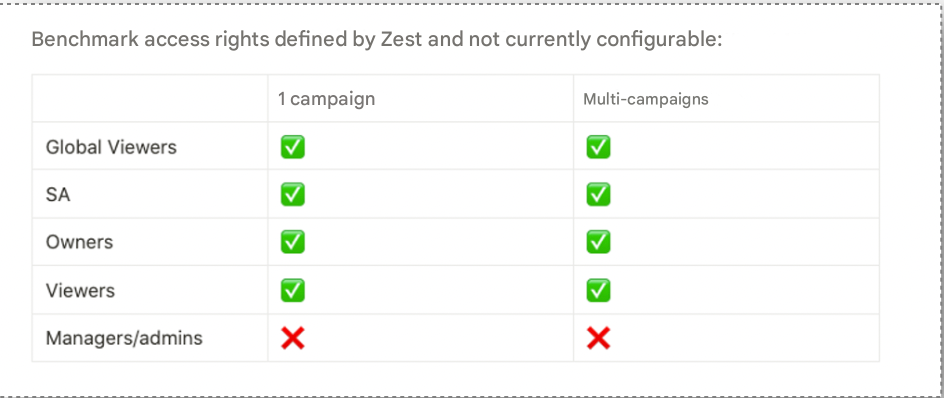
- Access restricted to Super Admins and Global Viewers (multi-campaign view).
- Can be enabled/disabled via Global settings in the Back Office (configured by SA).
⚠️ By default, the Benchmark comparison is disabled.
📤 Available exports
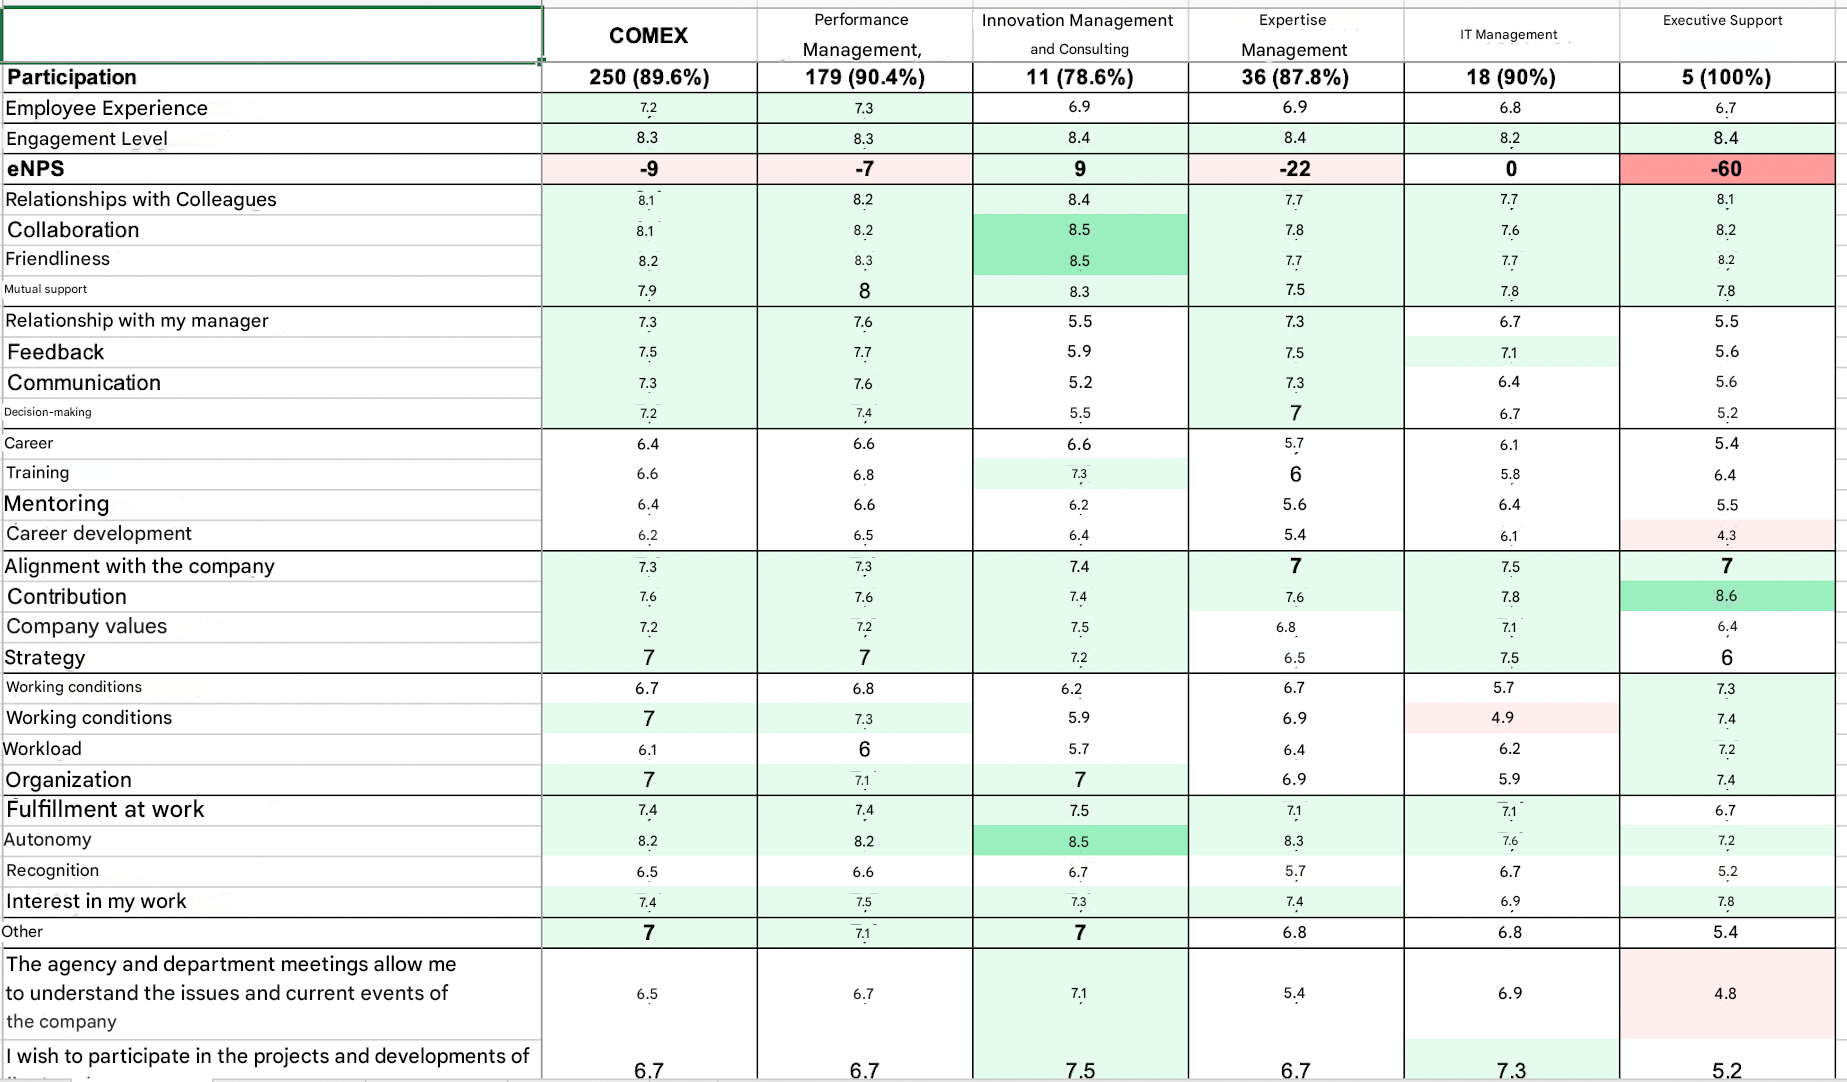
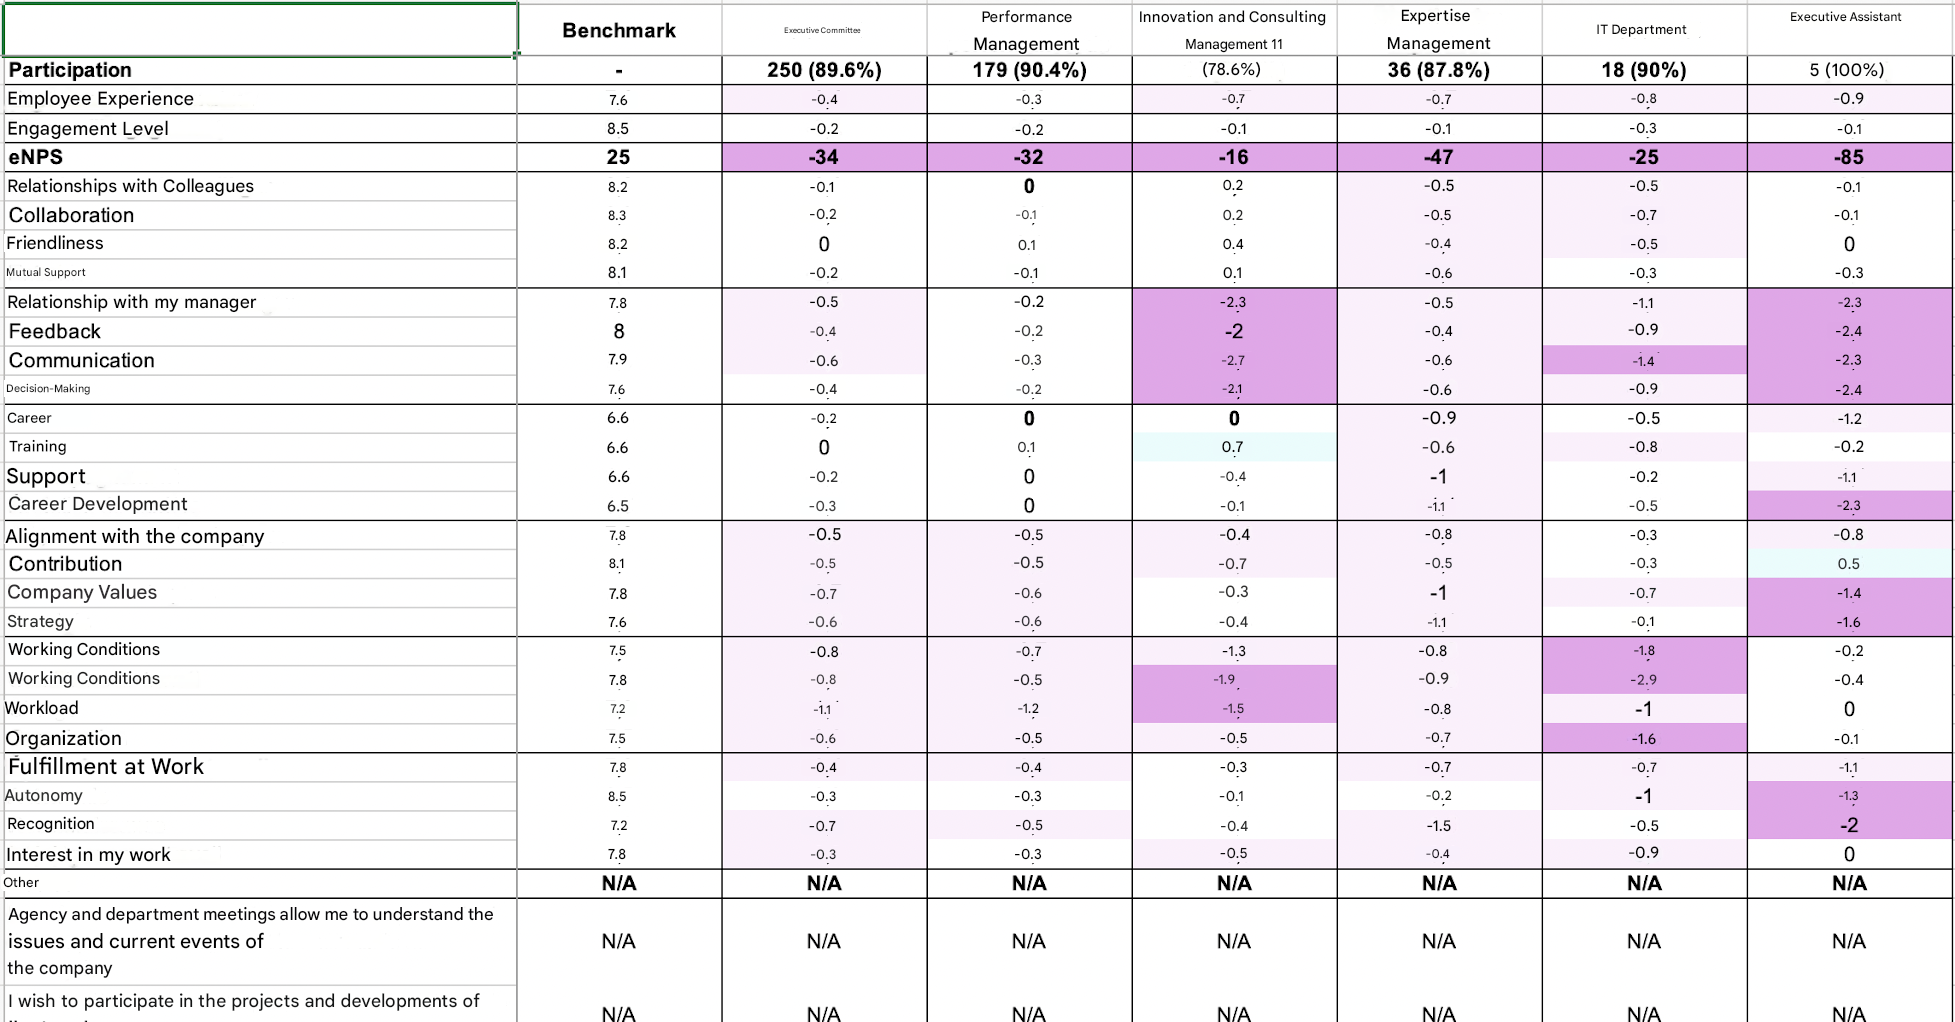
- Excel export from the Heatmap, based on selected filters.
- Each tab (Score, Evolution, Delta, Benchmark) corresponds to a sheet in the export.
- Filtering possible only on text or boolean (Y/N) attributes.
- 🚀 PowerPoint export planned in a future version.
📑 Excel exports: Results & Heatmap
The export contains 2 main sheets:
- All responses to questions (based on selected filters).
- Heatmap: comparison on the selected scope and all sub-levels (⚠️ no attribute or other filters applied).
Detail by question type
- Mood, Weather, Stars, Slider: average of responses /10.
- NPS: standard calculation (Promoters – Detractors) /100.
- Single & multiple choice: number of respondents per option.
- Matrix: detail of items to evaluate with number of respondents (same as choices).
- Open text: not included in the Heatmap.
⚠️ In case of grouping (anonymity), it is not applied in the Heatmap export (wording adjustment planned).